
Technically Speaking For April 1Summary
- Markit economic data from the EU was terrible.
- US data was mixed. Retail sales continue to disappoint but the ISM manufacturing number was solid.
- The small-caps are still under-performing their large-cap brethren.
The EU's Markit Economics Manufacturing PMI was terrible: here are the key findings:
- Final Eurozone Manufacturing PMI at 47.5 in March (Flash: 47.6, February Final: 49.3)
- The biggest monthly decline in new orders since late 2012
- Confidence hits its lowest level in over six years
Production and new orders declined, as did production for intermediate and investment goods. The manufacturing PMIs for the EU's three of the four largest economies (Germany, France, and Italy) are all below 50, indicating contraction. These are the worst readings since the Greek Debt Crisis of 2012. In related news, the UK's PMI rose to a strong 55.1. But this spike was due to heightened pre-Brexit preparations. Don't be surprised to see a post-Brexit drop in this number.
Mixed US news today. On the plus side, the ISM's manufacturing index was up 1.1 to 55.3. The anecdotal comments indicated that overall demand was fairly strong. This comment about the housing market bodes particularly well for the future (emphasis added):
Weather in the domestic market is constraining homebuilding across the nation — too wet in the south, severe winter in the north. Expectations are that homebuilding backlog is growing, and a surge of domestic business will come in May and June.
16 of 18 industries reported an increase in business. On the negative side, retail sales were down .2%. Three charts place the data into perspective: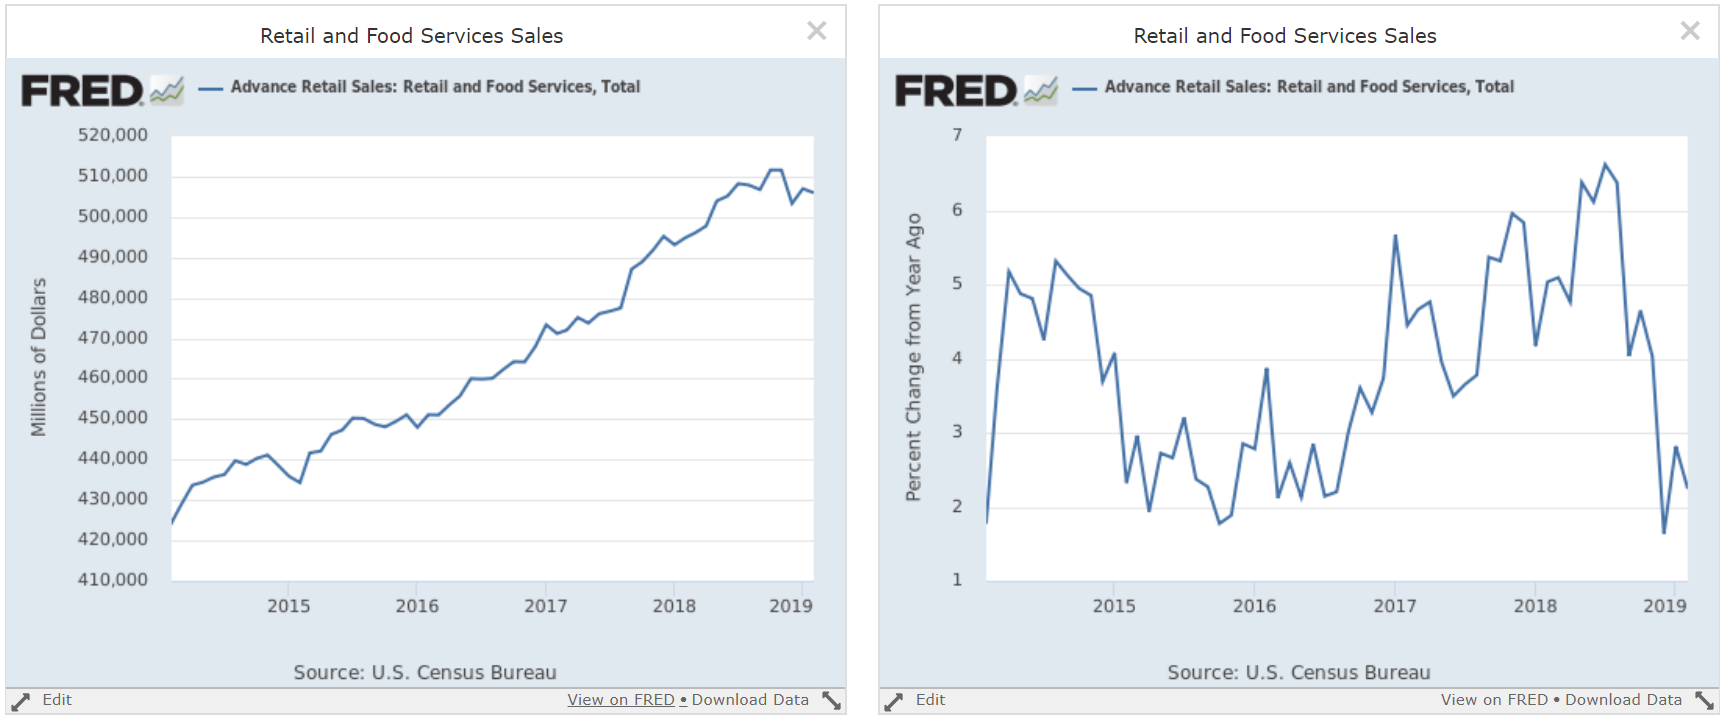
The left chart shows the absolute total number. It's flattened out over the last year and the Y/Y percentage increase on the right has clearly taken a hit. The third chart shows last year's results which better illustrate the flattening trend:

Total sales have decreased in five of the last 8 months - not exactly a vote of confidence in consumer behavior.
What is the "right" rate? The Cleveland Federal Reserve tracks a number of different measures which it then synthesizes into a median rate: 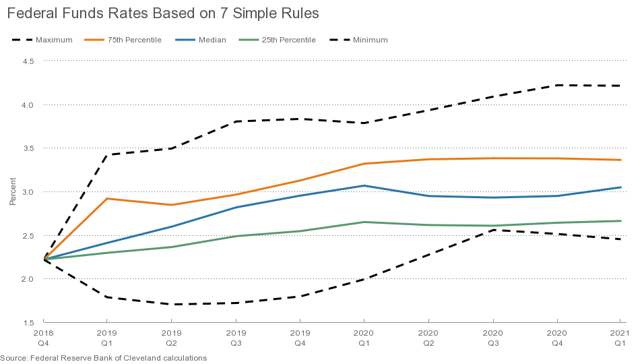
According to its blended model, the Cleveland Fed says rates should be right about 3%.
The markets had a good day:

The transports led the way higher, jumping 2.36%. But aside from the mid-caps (which were the third best performer), large-cap indexes continued to outperform. While the IWM gained a respectable 1.06%, it still underperformed the SPY and QQQ. On the other side, Treasuries sold off modestly.
As I noted in my weekly summation on Friday, the markets are sending conflicting signals with the bond market rallying and the smaller-cap indexes underperforming their large-cap brethren. That trend is still continuing. Let's start with the 5-day charts:

The 5-day SPY chart is pretty good. An uptrend started on March 27. Since then, prices have printed a series of higher lows and higher highs. Prices advanced through the lower 280s this morning on a gap higher - the second in two days.

The transports have an even stronger 5-day chart.

Meanwhile, the IEFs sold off a bit over the last two trading sessions. It's gapped lower the last two trading sessions.
The 30-day charts are mixed:

On the plus side is the SPY. It moved higher in a parabolic arch from March 11-19. It sold off a touch between March 21-29, forming a rounding bottom. Today, it gapped higher, moving through the mid 280s. However, the MACD is a bit stretched.

The IEF has sold off a bit. But it's only moved to the top Fib line, which is also above the 200-day EMA.

And then we have the IWM, which is still only 2/3 of the way higher relative to its 30-day performance. The lower and upper 154 price level still poses upside resistance.
And then we have the daily charts:

The SPY has been in a solid uptrend since the end of last year. That's good news.

The IWM is still in a modestly downward sloping trend. Also notice the modestly increasing volume on the downswings, especially the move in mid-March. This index still remains below highs from earlier in the year.
Despite the good news in today's performance numbers, the overall trend of outperforming large-caps and underperforming small-caps remains intact.
Disclosure: I/we have no positions in any stocks mentioned, and no plans to initiate any positions within the next 72 hours. I wrote this article myself, and it expresses my own opinions. I am not receiving compensation for it (other than from Seeking Alpha). I have no business relationship with any company whose stock is mentioned in this article.