Technically Speaking September 18, 2019
- The Fed cut rates largely out of concern of future uncertainty.
- Business executives are petitioning Congress to curtail the president's unilateral tariff capabilities.
- The market's reaction to the rate cut was interesting.
The Fed cut rates 25 basis points. The reasoning is ... interesting. Let's start with the Fed's opinion of the current situation:
Job gains have been solid, on average, in recent months, and the unemployment rate has remained low. Although household spending has been rising at a strong pace, business fixed investment and exports have weakened. On a 12-month basis, overall inflation and inflation for items other than food and energy are running below 2 percent. Market-based measures of inflation compensation remain low; survey-based measures of longer-term inflation expectations are little changed.
The economy is at full employment and prices are contained. The Fed could very easily say it has done its job and leave rates unchanged. But it lowered rates out of concern for the heightened level of uncertainty:
... the Committee decided to lower the target range for the federal funds rate to 1-3/4 to 2 percent. This action supports the Committee's view that sustained expansion of economic activity, strong labor market conditions, and inflation near the Committee's symmetric 2 percent objective are the most likely outcomes, but uncertainties about this outlook remain.
In other words, the potential downside is what forced the Fed's hand. What's also interesting is there were three dissents: Bullard -- who wanted a 50 basis point cut, and George and Rosengren who both wanted to keep rates unchanged. Bullard has been concerned about the low inflation situation for some time while the George/Rosengren argument -- that the economy is right where the economy should be (low unemployment and contained prices) -- is just as valid.
The NY Fed injected cash into the short-term funding market again (emphasis added):
The New York Fed offered $75 billion in cash to broader markets, in exchange for eligible collateral such as U.S. Treasury bonds or mortgage-backed securities, in order to hold the Fed's key rate inside its target range of between 2% and 2.25%.
Nonetheless, the repeat overnight repo operation later today -- only the second in ten years -- will add to market jitters as to what Powell and his colleagues are likely to say about future rate hikes, and the unwinding of the Fed's $3.8 trillion balance sheet, in the months ahead.
Credit market problems are usually a precursor to economic problems, which is why lower-rated credit yields comprise some longer-leading indicators. The short-term asset-backed market is part of the standard Moore-Burns economic cycle analysis that I use for Turning Points. This situation isn't remotely dangerous yet; the explanation that a series of coalescing events (corporate tax payments; the Fed allowing some of its portfolio to run-off) is viable. But should it continue, we'll need to know more about what is happening below the surface.
Let's take a look at today's performance table.
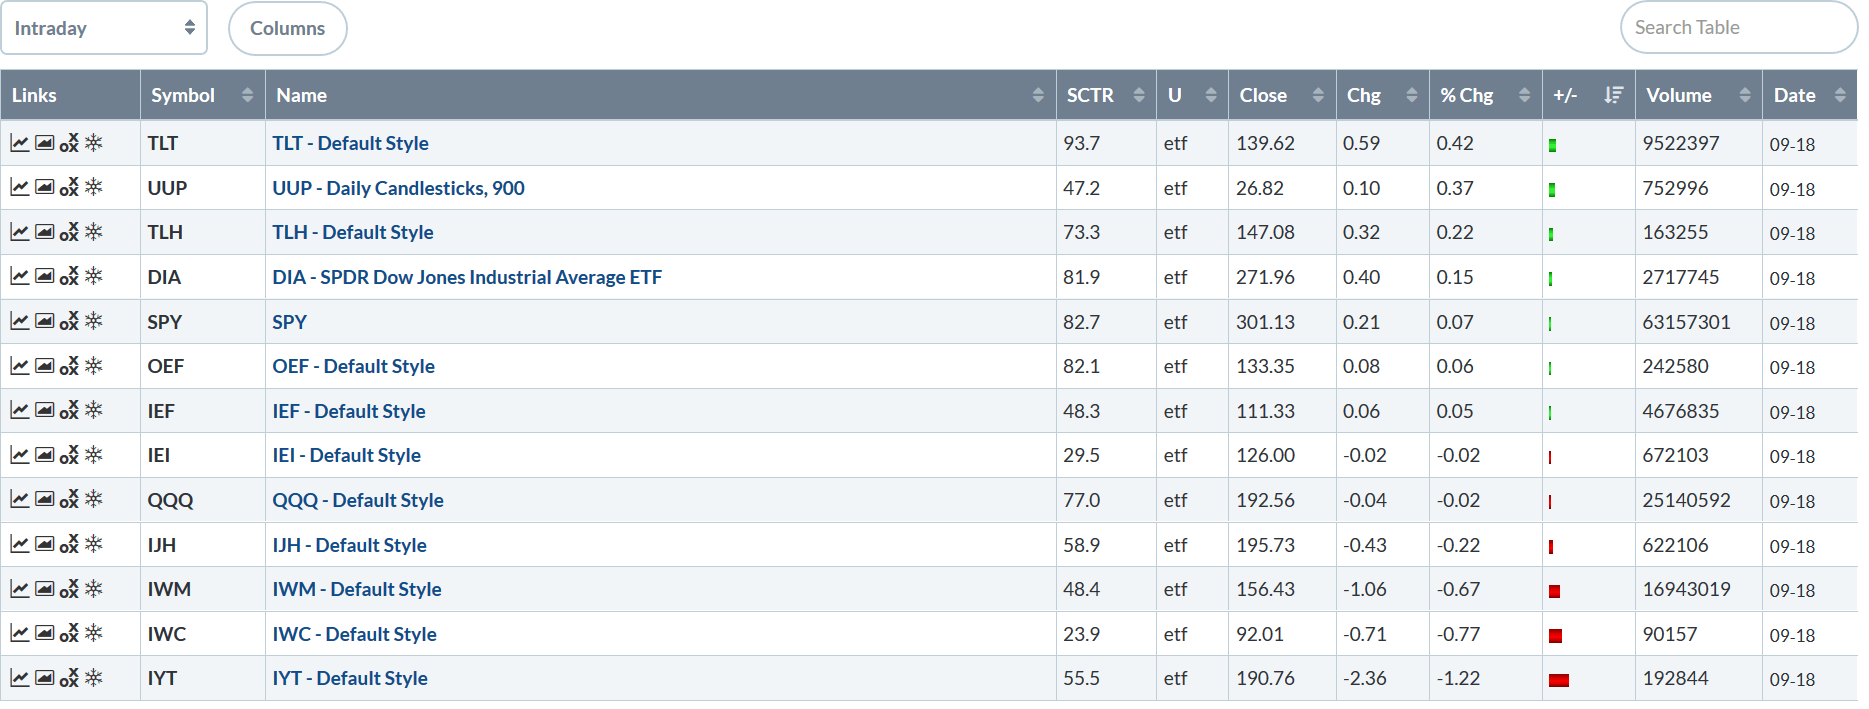
The long end of the Treasury market was up today -- which is to be expected: lower rates mean already issued bonds are more valuable. Large-caps were up modestly while the belly of the curve was more or less unchanged. Smaller-caps were down a bit.
Today's chart for the SPY is very interesting:
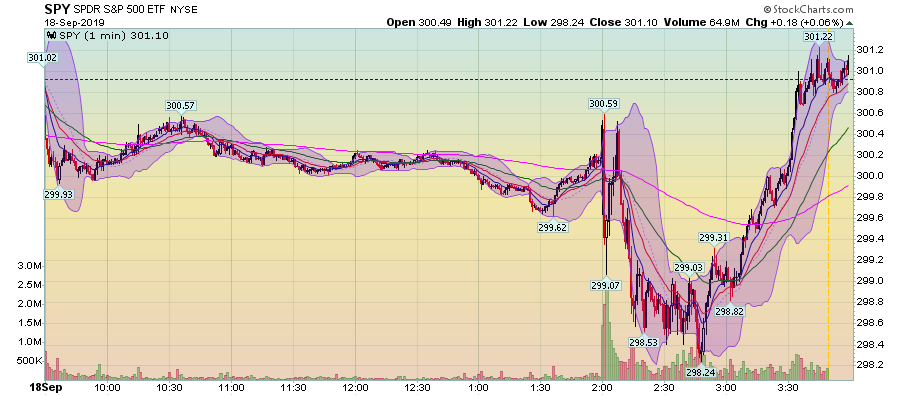
Prices were off modestly throughout the morning, which is a pretty typical pre-Fed pattern. After the policy release, the market sold off sharply. My thought is that, despite the rate cut, the market was disappointed by the preventative reasoning. But the market caught a bid about 2:30 and rallied into the close, eventually closing right around unchanged. It's almost as though the market said, "wait -- rates are lower now."
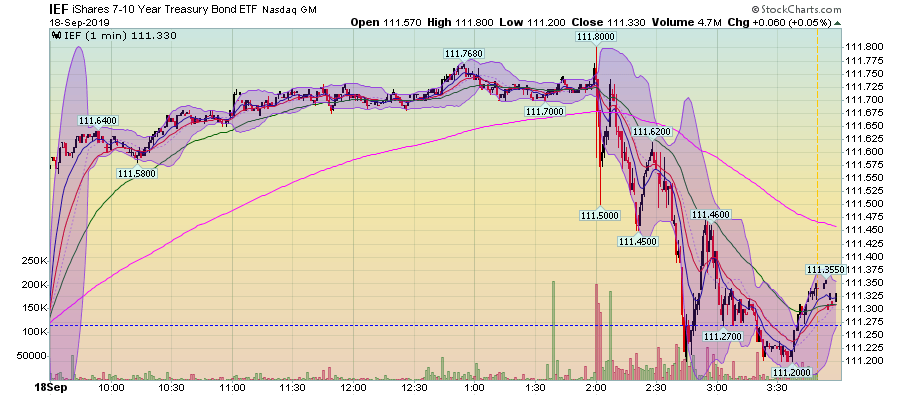
Meanwhile, the IEF sold off after the announcement.
Let's pull back to the 2-week time frame.
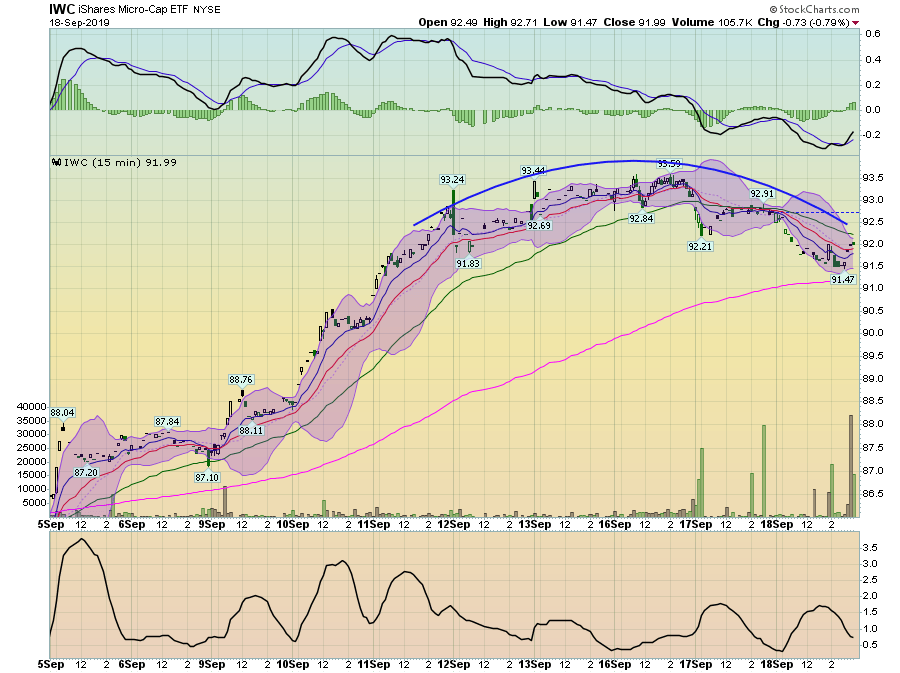
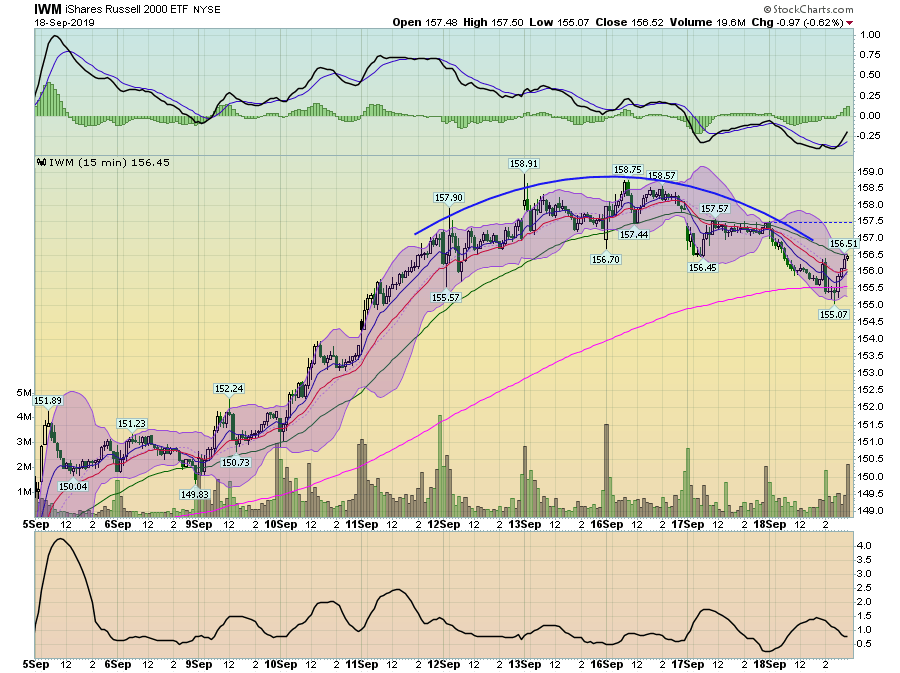
Last week, micro-caps (top chart) and small-caps (bottom chart) did very well. But now both are forming rounding tops, which is a classic topping pattern.
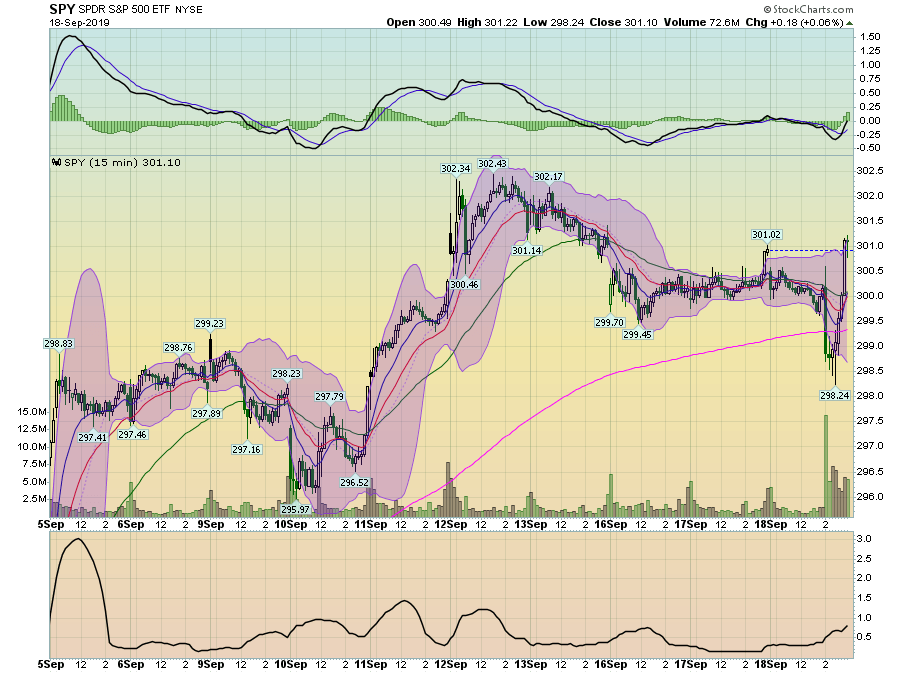
However, there is no meaningfully discernible pattern on the 2-week SPYs (or the QQQ)s.
Let's pull back a little further to the 30-day time-frame ...
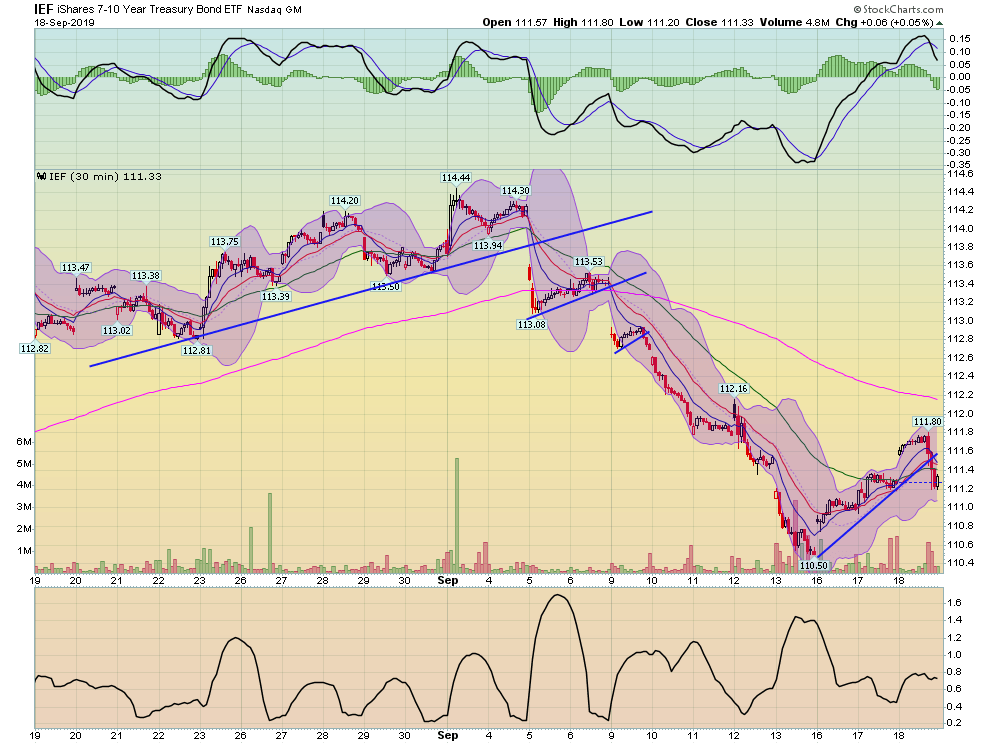
... where we see that the Treasury market selloff is still in progress.
Finally, consider the daily charts:
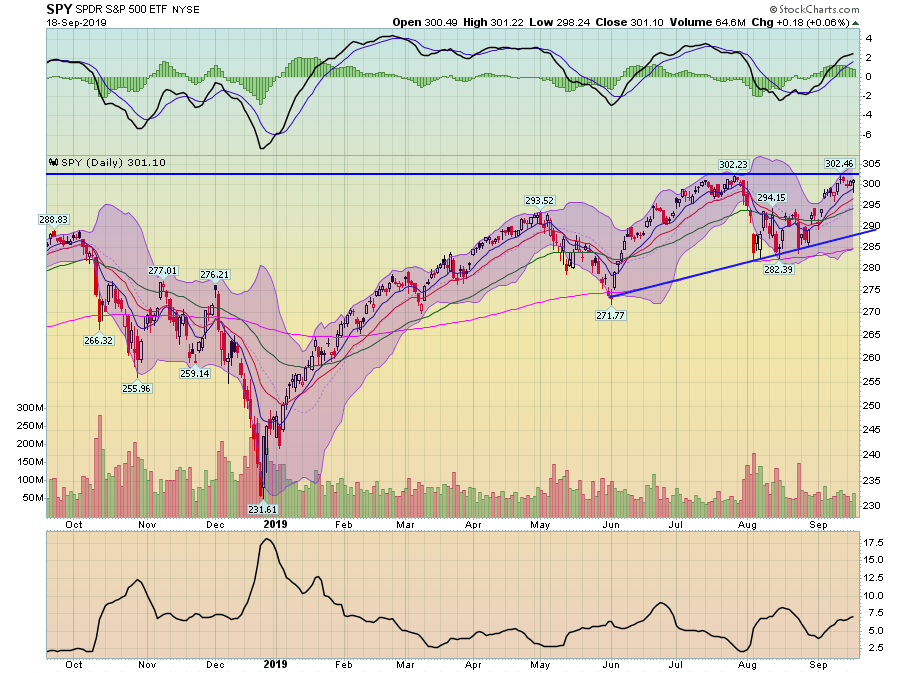
The SPY is still consolidating below recent highs in the lower 300s. The QQQs are also contained by their respective trend line.
As I noted yesterday, the SPY chart (along with the QQQ) is perfectly aligned for a breakout rally. Yet, it didn't happen today. That doesn't mean it won't happen; tomorrow (or sometime over the next week, assuming there isn't a selloff) there could be a great trade catalyst. But a rate cut in a strong economy (remember the Fed said this move was "preventative") should have thrilled the market. Instead, today's trade fizzled.
