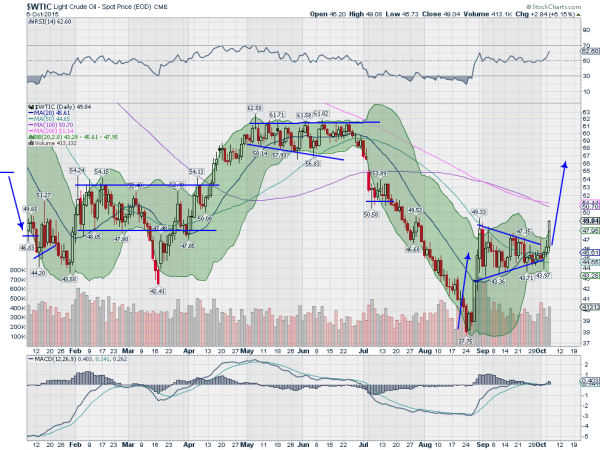
Oil lit up traders screens yesterday with a strong move higher. It still has not gotten over the August high but looks like it may Wednesday. Just how high can it go? Technically, it has a lot further to run.
The chart above shows the move higher in West Texas Crude, out of a technical pattern, a symmetrical triangle. This action suggests a continuation higher. With the strong momentum indicators (RSI and MACD) backing it up, it gives a target to the upside of about $57.
You can see that it has potential to run into some over head supply there as it exchanged hands among traders in a range from $58 to $61 for nearly two months this Spring. But that is still a long way above. Enjoy the gush higher for now.
The information in this blog post represents my own opinions and does not contain a recommendation for any particular security or investment. I or my affiliates may hold positions or other interests in securities mentioned in the Blog, please see my Disclaimer page for my full disclaimer.

