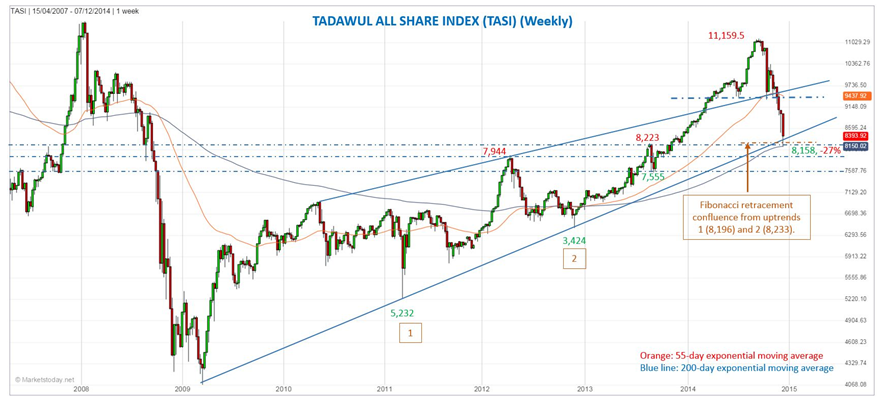
After being down as much 8.9% last week the Tadawul All Share ended 6.3% lower, closing at 8,393.9. At the 8,158 low hit Thursday the TASI had fallen 27% from its 11,159.5 peak reached in early-September.Although too early to call a bottom with much certainty, especially given the continued weakness in oil, global and regional equity markets, the TASI has hit a potential support zonethat could lead to a rebound, based on several indications.

Thursday’s decline found support near the long-term trend indicator, the 200-week exponential moving average (ema) (8,150). It’s common for at least a bounce to be seen off such a long-term indicator when it’s first approached/tested as support. The TASI moved above the 200-week ema around December 2012 and hasn’t been near it since.
The market then rallied into the close Thursday creating a bullish reversal candle (Hammer). Since the descent started in September no leg down has seen similar price action on a daily basis at the end of a decline, pointing to a change in momentum.
Last week’s low of 8,158 was also in the region of a potential support zone, based on prior price action, from 8,223 to 8,188. That area was also where the long-term uptrend line converges. In addition, there is confluence of two Fibonacci retracement levels at 8,233 and 8,196, derived from the #1 and #2 uptrends which can be seen on the enclosed chart. If the TASI does drop below last week’s low watch for the next support area around 7,944. (www.marketstoday.net)
