
With the dollar breaking key support and resistance levels versus its major counterparts, and given the lack of economic calendar events, emphasis is shifted on the technicals again. On Friday, the best U. of Michigan consumer sentiment reading since July 2007 and the large beat by the Conference Board leading indicators caused across-the-board dollar gains, with the Dollar Index (DXY) breaking out from key resistance, closing at an almost three year high. The latest Commitment of Traders report for the week ending 14th May, in fact shows large increases in Euro, yen, Swisse and Aussie short contracts, with the first three having a 75% weighting on the DXY. U.S. equities also gained close to 1%, with the McClellan Oscillator on the NYSE rebounding before going into bearish territory.
The commodity currencies were the ones that performed the worst against the dollar this week. The Aussie, the Kiwi and the South African rand lost 3%, with AUS/USD and NZD/USD breaking down from key trendline support, whilst USD/ZAR rebounded from its two-year old upward-sloping support trendline. Versus the greenback the euro lost the least from the 7 majors, finding support at 1.2800, the historic moving average since the euro’s circulation in 2002. However, with the “death cross” between the 50-day and 200-day MA completing on Friday, history points to further EUR/USD losses, with the huge head-and-shoulders formation adding to the bearish outlook.
A back-test we’ve conducted reveals that since the euro’s circulation, there have been 5 death crosses that generated for the shorts a mean (median) return of 5.57% (4.35%) within 45 (47) days, with only 1 of those 5 death crosses leading to a EUR/USD appreciation of more than 1% within that time period. To place the significance of the EUR/USD death cross in perspective, the “golden cross”, which is when the 50-day MA moves above the 200-day MA, has in 5 out of 6 occurrences (83%) moved more than 1% the opposite direction than the one anticipated. Of greater importance, however, is the head-and-shoulders formation, which started in September 2012, since these formations have shown to have statistical significance, being rather reliable despite their massive targets. Although the price target set by the current formation is below 1.20, 1.21 is a more probable target. It sees tested trendline support, being also a reversal level, is the target based on past death crosses, and is a more conservative target given that about half of head and shoulders meet their large target, with 94% making at least a 5% move. That said two-thirds of head and shoulders tops do test the neckline once penetrated, so patience is required.
Amazingly, the only data out of the EU today are Italian industrial orders and sales for which there are no available forecasts. In the U.S., the Chicago Fed National Activity Survey is due, with no estimate released. Tuesday sees the release of the UK price data, with Wednesday having monetary policies at the centre of attention as the BoJ convenes, the FOMC and BoE release the minutes of their last meeting, and Bernanke testifies, with the markets waiting whether or not he will hint the tapering off of QE. Thursday is PMI day, with the U.S., China, France, Germany and the Eurozone as a whole all forecasted to see improvements in their flash PMIs. The week ends with the U.S. durable goods orders, and the German consumer and business confidence surveys.
The Market
EUR/USD
 EUR/USD" title="EUR/USD" width="640" height="444" />
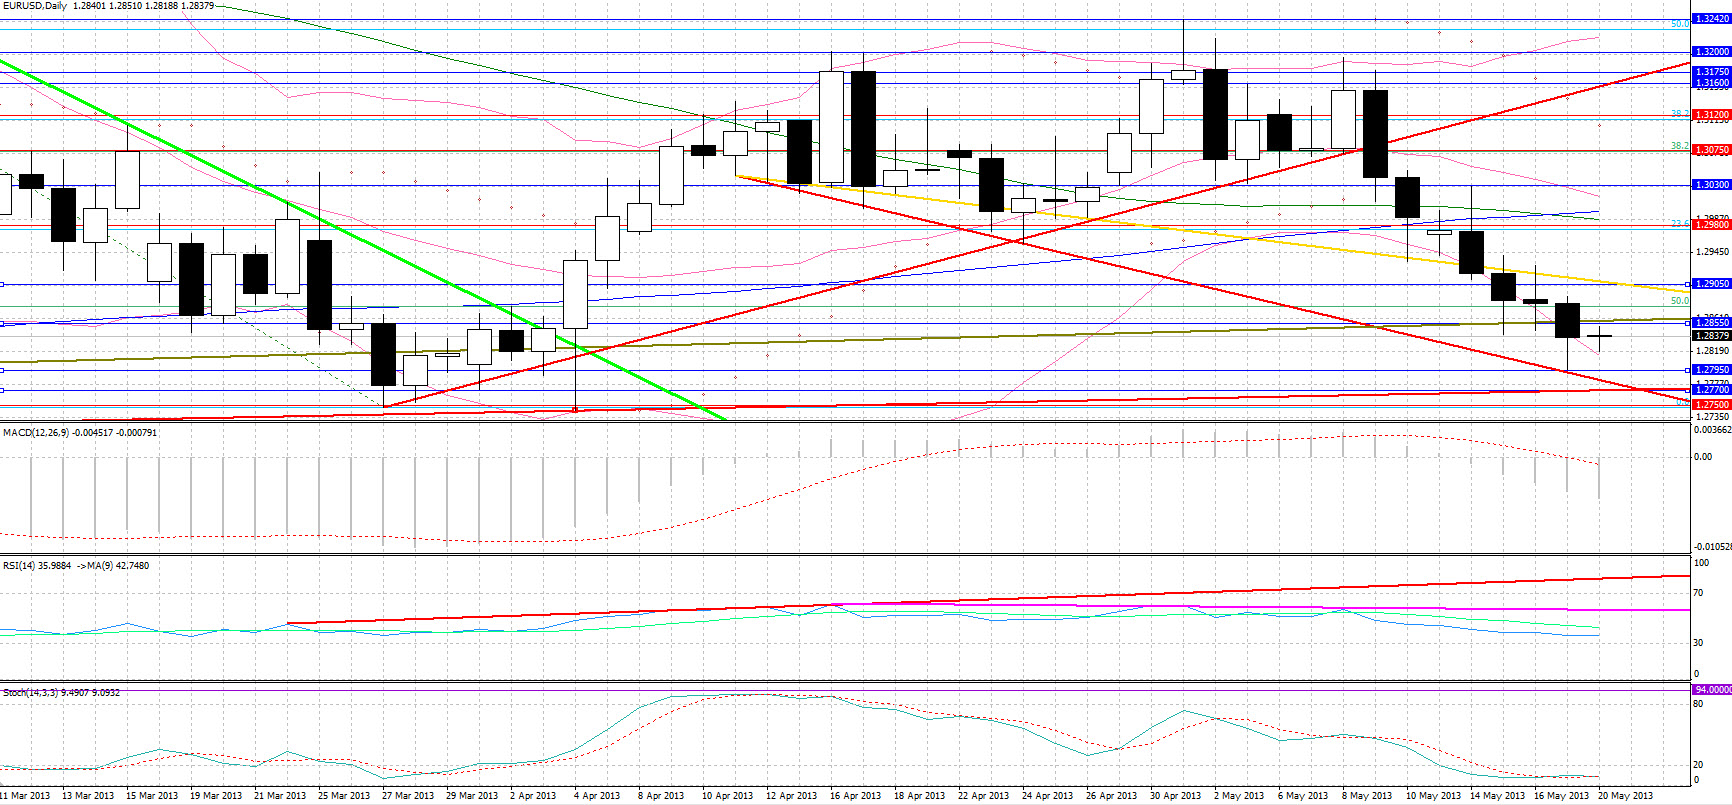
• EUR/USD was finding support for the greatest part of the Friday session at 1.2855, the neckline of its head-and-shoulders formation based on our closes, breaking down from that level on a technical move. Trendline support came at 1.2795, with a surprise 30 pip rebound occurring on the announcement of the strong U.S. consumer confidence data. The better-than-expected CB leading indicators released within minutes slightly corrected the rebound but the lows were not tested again, with resistance, however coming at 1.2840. Support is likely to come in the 1.2795 – 1.2770 area, with the latter figure being the head-and-shoulders neckline based on the spikes. A breakdown from that area is likely to penetrate the 1.2750 low seen in 2013, with stronger support, at least initially coming at 1.2680, the 6 month low which is also the 61.8% retracement level of the July – February rally. Resistance is likely to come at 1.2860, with a breakout from that level placing resistance at 1.2905.
USD/JPY
 USD/JPY" title="USD/JPY" width="640" height="444" />
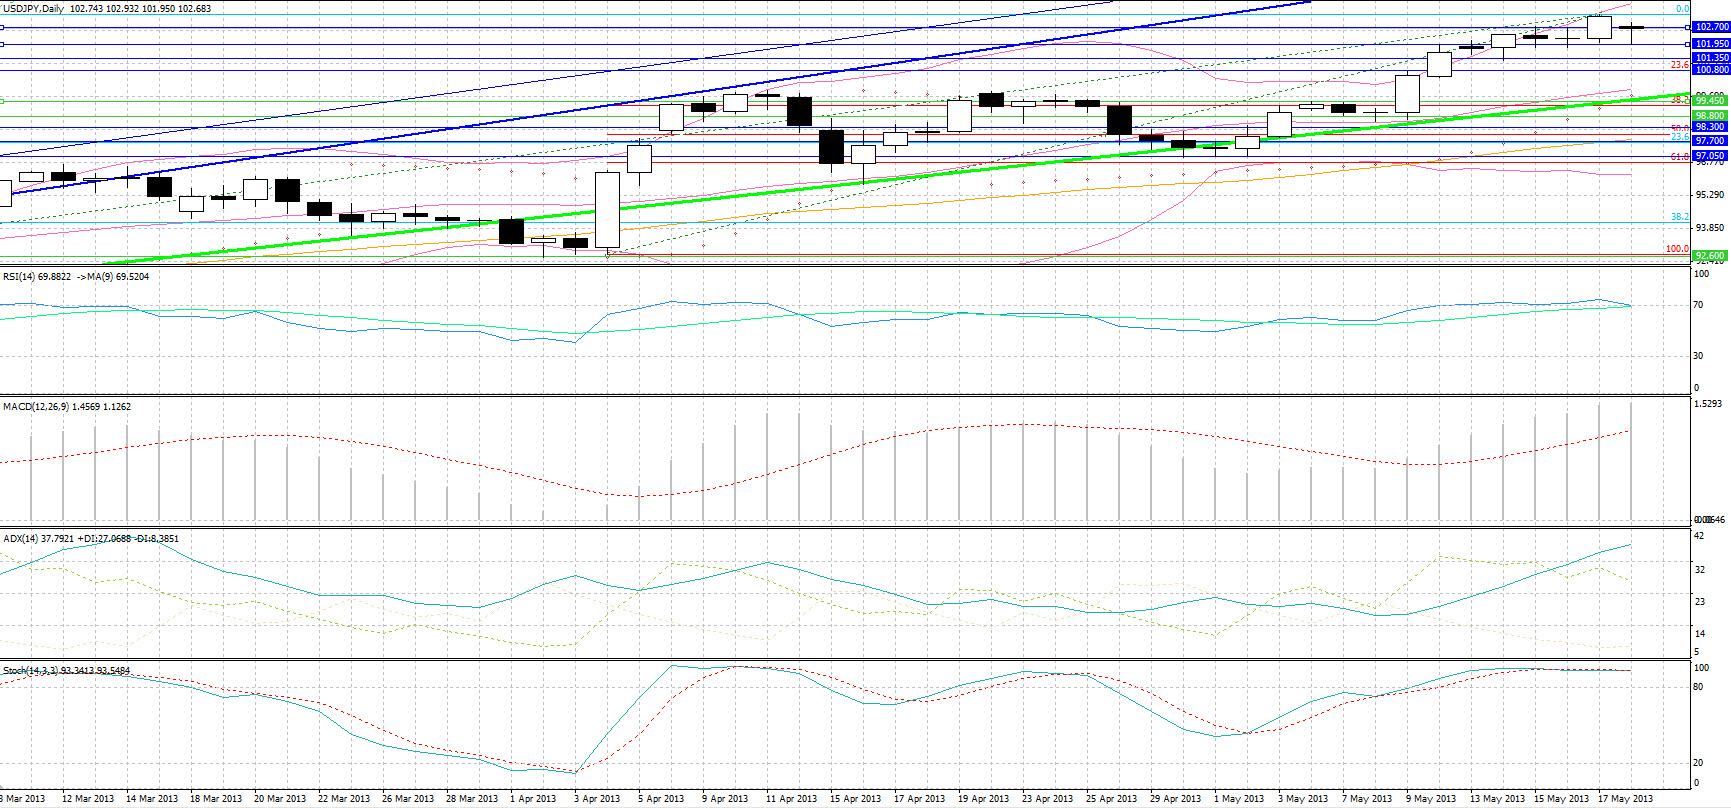
• Having found support at 102.30 for the first half of the day, USD/JPY broke out from 102.70 resistance on the better-than-expected U.S. data, thereafter preserving and building on those gains. The pair, however, opened the week with a downward gap at 102.70 following Sunday comments by Japan’s Finance Minister that “if the yen keeps on weakening a lot more, it will have a negative impact on peoples’ lives”. Initial support comes at 101.95, with support thereafter at 101.35. The 103.30 high is likely to act as resistance again with further resistance at 103.90. Traders should note, however that RSI and the Stochastics are at overbought levels with both momentum indicators likely to form bearish crossovers, should we close lower.
USD/CAD
 USD/CAD" title="USD/CAD" width="640" height="444" />
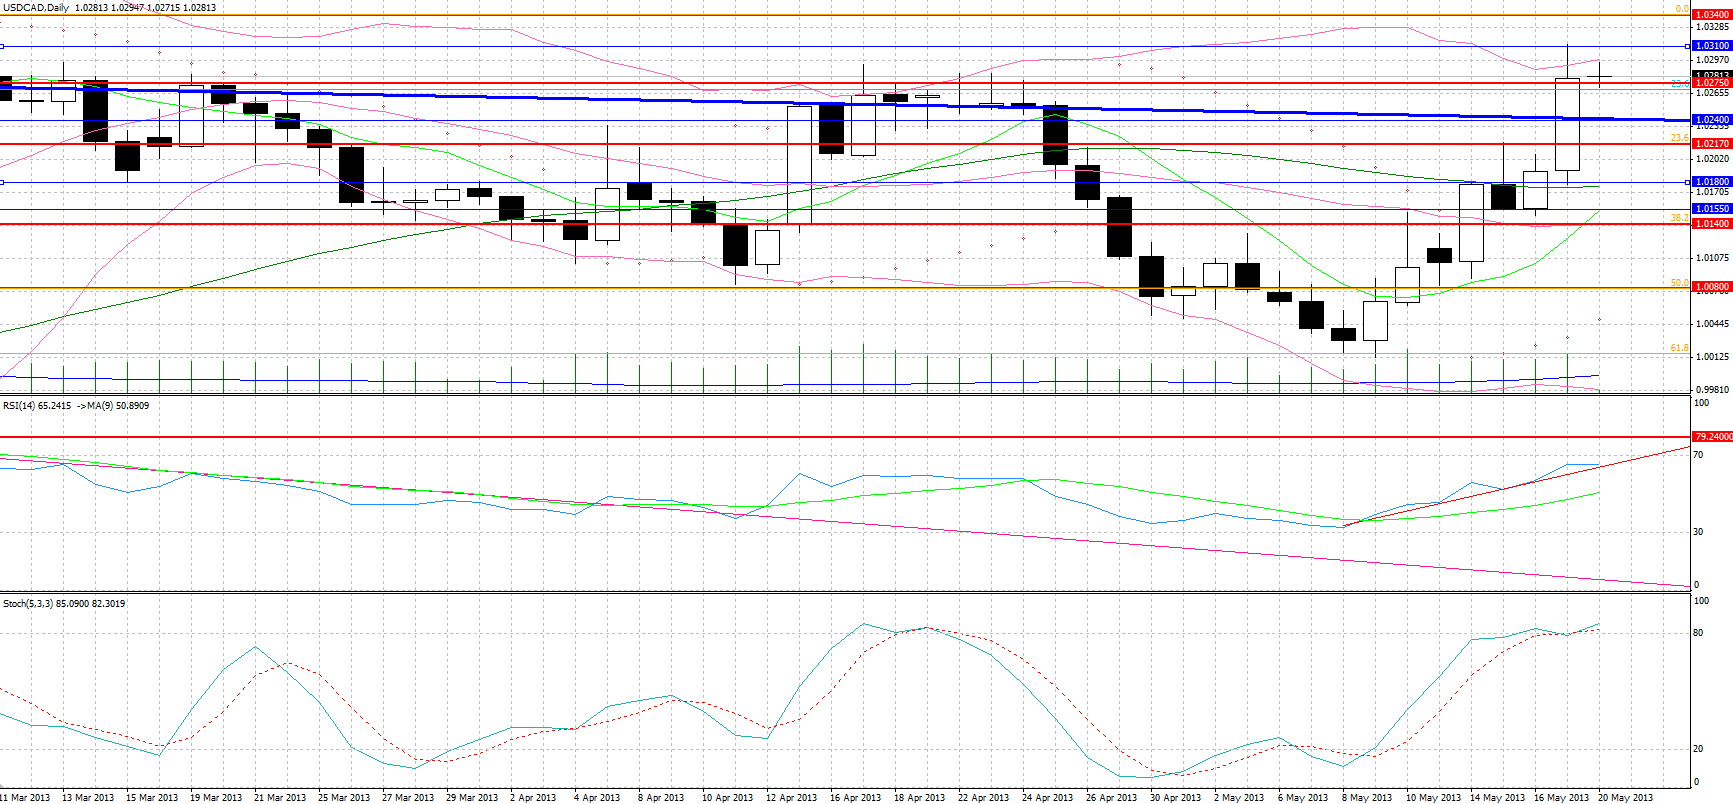
• The falling, worse-than-expected Canadian CPI readings did not move the pair, but the better-than-anticipated U.S. data caused USD/CAD to breakout from its 1.0240 converging pattern resistance that has been developing since February 2010. That said there have been whipsaws in the past so prudence should be exercised. Support for one of Friday’s biggest movers comes at 1.0275, the 23.6% retracement level of the massive plunge from March 2009 to July 2011, with resistance coming at 1.0310, near the one year highs. Trendline support is seen at 1.0240, with further resistance at 1.0340.
Gold

• Gold bears are in seventh heaven as the asset declined for a seventh consecutive day, losing more than 6% last week. The dollar-bullish U.S. data caused a breakdown from $1370 support, with the asset today breaking down from $1350 support. Strong support now comes at the recent lows of $1322 – 1330, with notable Fibonacci levels in the 1285 – 1300 area. Resistance is likely to be seen at $1350 and $1370.
WTI

• WTI was a major gainer on Friday, continuing with its rally on expectations of increased demand due to the driving season, spiking to $96.45 resistance, before retracing as the dollar gained on the release of positive U.S. data, with a late rebound finding resistance at $96.20. Strong trendline resistance comes at $97.30, with trendline support coming at $95.50, with further support levels at $94.50, $93.50, which sees the 50-day MA, and $92.35, which sees the 200-day MA. Should WTI close on the upside, it will be forming a bullish RSI-MA crossover, though traders should also note that the Stochastics oscillator is in overbought territory.
BENCHMARK CURRENCY RATES - DAILY GAINERS AND LOSERS

MARKETS SUMMARY

The commodity currencies were the ones that performed the worst against the dollar this week. The Aussie, the Kiwi and the South African rand lost 3%, with AUS/USD and NZD/USD breaking down from key trendline support, whilst USD/ZAR rebounded from its two-year old upward-sloping support trendline. Versus the greenback the euro lost the least from the 7 majors, finding support at 1.2800, the historic moving average since the euro’s circulation in 2002. However, with the “death cross” between the 50-day and 200-day MA completing on Friday, history points to further EUR/USD losses, with the huge head-and-shoulders formation adding to the bearish outlook.
A back-test we’ve conducted reveals that since the euro’s circulation, there have been 5 death crosses that generated for the shorts a mean (median) return of 5.57% (4.35%) within 45 (47) days, with only 1 of those 5 death crosses leading to a EUR/USD appreciation of more than 1% within that time period. To place the significance of the EUR/USD death cross in perspective, the “golden cross”, which is when the 50-day MA moves above the 200-day MA, has in 5 out of 6 occurrences (83%) moved more than 1% the opposite direction than the one anticipated. Of greater importance, however, is the head-and-shoulders formation, which started in September 2012, since these formations have shown to have statistical significance, being rather reliable despite their massive targets. Although the price target set by the current formation is below 1.20, 1.21 is a more probable target. It sees tested trendline support, being also a reversal level, is the target based on past death crosses, and is a more conservative target given that about half of head and shoulders meet their large target, with 94% making at least a 5% move. That said two-thirds of head and shoulders tops do test the neckline once penetrated, so patience is required.
Amazingly, the only data out of the EU today are Italian industrial orders and sales for which there are no available forecasts. In the U.S., the Chicago Fed National Activity Survey is due, with no estimate released. Tuesday sees the release of the UK price data, with Wednesday having monetary policies at the centre of attention as the BoJ convenes, the FOMC and BoE release the minutes of their last meeting, and Bernanke testifies, with the markets waiting whether or not he will hint the tapering off of QE. Thursday is PMI day, with the U.S., China, France, Germany and the Eurozone as a whole all forecasted to see improvements in their flash PMIs. The week ends with the U.S. durable goods orders, and the German consumer and business confidence surveys.
The Market
EUR/USD
EUR/USD" title="EUR/USD" width="640" height="444" />• EUR/USD was finding support for the greatest part of the Friday session at 1.2855, the neckline of its head-and-shoulders formation based on our closes, breaking down from that level on a technical move. Trendline support came at 1.2795, with a surprise 30 pip rebound occurring on the announcement of the strong U.S. consumer confidence data. The better-than-expected CB leading indicators released within minutes slightly corrected the rebound but the lows were not tested again, with resistance, however coming at 1.2840. Support is likely to come in the 1.2795 – 1.2770 area, with the latter figure being the head-and-shoulders neckline based on the spikes. A breakdown from that area is likely to penetrate the 1.2750 low seen in 2013, with stronger support, at least initially coming at 1.2680, the 6 month low which is also the 61.8% retracement level of the July – February rally. Resistance is likely to come at 1.2860, with a breakout from that level placing resistance at 1.2905.
USD/JPY
USD/JPY" title="USD/JPY" width="640" height="444" />• Having found support at 102.30 for the first half of the day, USD/JPY broke out from 102.70 resistance on the better-than-expected U.S. data, thereafter preserving and building on those gains. The pair, however, opened the week with a downward gap at 102.70 following Sunday comments by Japan’s Finance Minister that “if the yen keeps on weakening a lot more, it will have a negative impact on peoples’ lives”. Initial support comes at 101.95, with support thereafter at 101.35. The 103.30 high is likely to act as resistance again with further resistance at 103.90. Traders should note, however that RSI and the Stochastics are at overbought levels with both momentum indicators likely to form bearish crossovers, should we close lower.
USD/CAD
USD/CAD" title="USD/CAD" width="640" height="444" />• The falling, worse-than-expected Canadian CPI readings did not move the pair, but the better-than-anticipated U.S. data caused USD/CAD to breakout from its 1.0240 converging pattern resistance that has been developing since February 2010. That said there have been whipsaws in the past so prudence should be exercised. Support for one of Friday’s biggest movers comes at 1.0275, the 23.6% retracement level of the massive plunge from March 2009 to July 2011, with resistance coming at 1.0310, near the one year highs. Trendline support is seen at 1.0240, with further resistance at 1.0340.
Gold
• Gold bears are in seventh heaven as the asset declined for a seventh consecutive day, losing more than 6% last week. The dollar-bullish U.S. data caused a breakdown from $1370 support, with the asset today breaking down from $1350 support. Strong support now comes at the recent lows of $1322 – 1330, with notable Fibonacci levels in the 1285 – 1300 area. Resistance is likely to be seen at $1350 and $1370.
WTI
• WTI was a major gainer on Friday, continuing with its rally on expectations of increased demand due to the driving season, spiking to $96.45 resistance, before retracing as the dollar gained on the release of positive U.S. data, with a late rebound finding resistance at $96.20. Strong trendline resistance comes at $97.30, with trendline support coming at $95.50, with further support levels at $94.50, $93.50, which sees the 50-day MA, and $92.35, which sees the 200-day MA. Should WTI close on the upside, it will be forming a bullish RSI-MA crossover, though traders should also note that the Stochastics oscillator is in overbought territory.
BENCHMARK CURRENCY RATES - DAILY GAINERS AND LOSERS
MARKETS SUMMARY