Weekly Report
EUR/USD 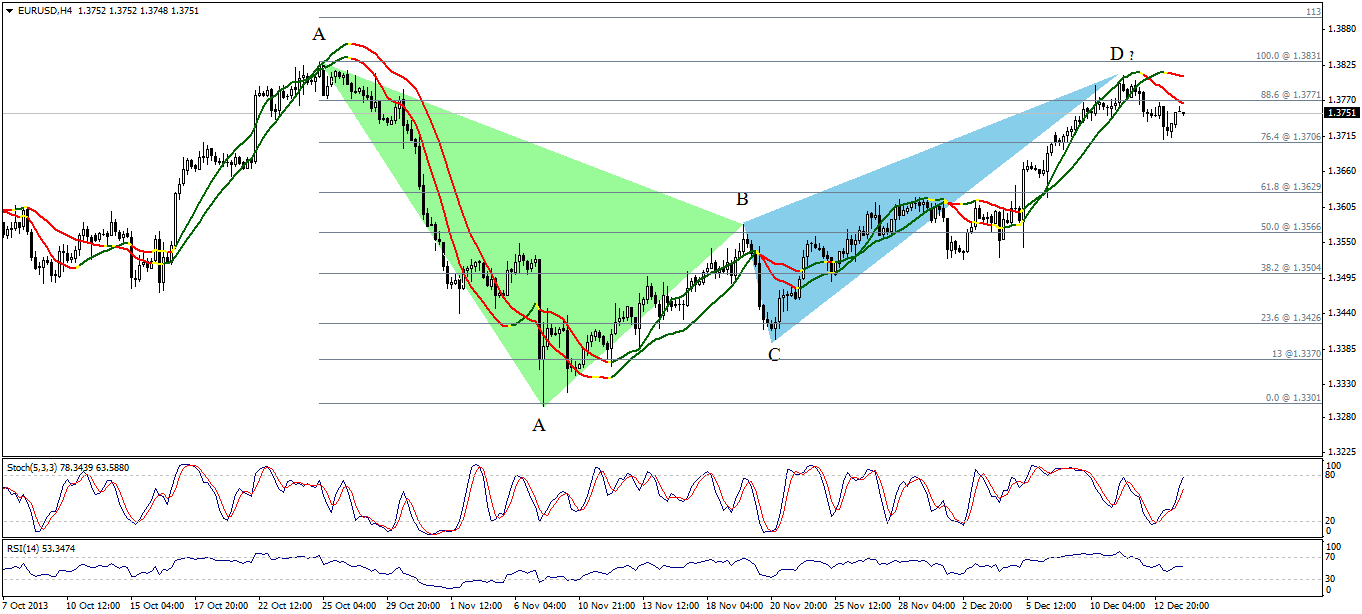 EUR/USD Hourly Chart" title="EUR/USD Hourly Chart" width="1363" height="615">
The pair started this week’s trading slightly to the upside but is still limited below Linear Regression Indicators and 88.6% correction showing on graph. Therefore the possibility of moving to the downside is available this week affected by the bearish harmonic Bat Pattern. Stochastic is approaching overbought areas supporting the suggested negativity.
Of note, breaching 1.3830 could fail the harmonic pattern and trigger a new bullish wave. EUR/USD S&R Chart" title="EUR/USD S&R Chart" width="1363" height="615">
GBP/USD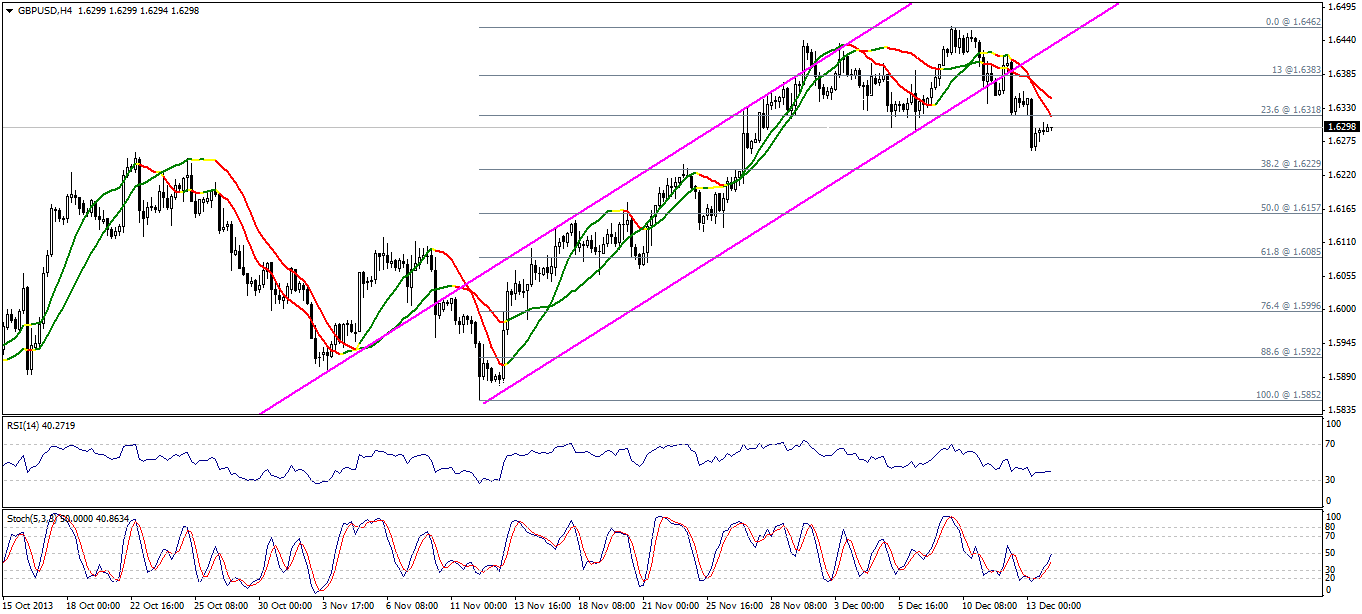 GBP/USD Hourly Chart" title="GBP/USD Hourly Chart" width="1363" height="615">
Breaking 1.6360 followed by stabilizing below 23.6% correction at 1.6315 showing on graph confirmed the downside move. Trading below 1.6410 keeps the bearish possibility this week but stabilizing below 1.6360 is better to strengthen these expectations. The suggested target of the current downside move is 38.2% correction followed by 50% and 51.8% corrections respectively, as breaking them will trigger the possibility of touching the next level. Linear Regression Indicators are negative supporting our expectations. GBP/USD S&R Chart" title="GBP/USD S&R Chart" width="1363" height="615">
USD/JPY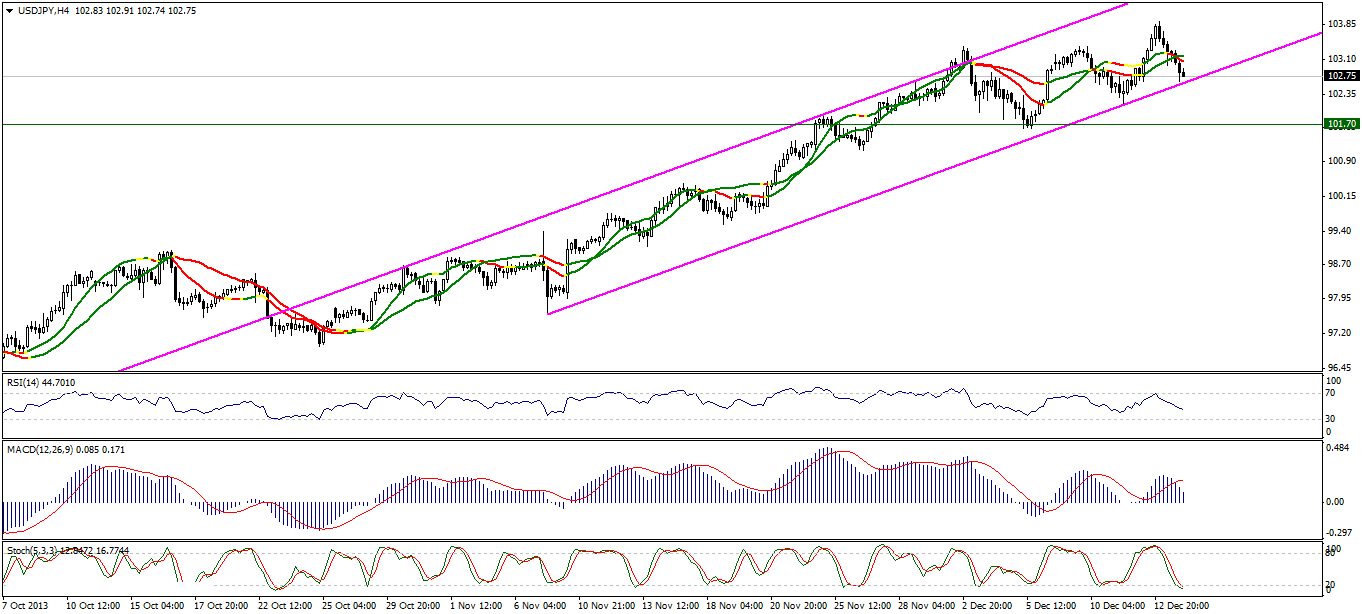 USD/JPY Hourly Chart" title="USD/JPY Hourly Chart" width="1363" height="615">
The pair moved to the downside with the beginning of this week but is still within the ascending channel as shown on graph. Stability above 102.50 keeps the bullish possibility available again, as the pair has to break 101.70 to confirm a bearish correction. We will benefit from approaching 101.70 to enter an overbought area, whereas we bet on the overall upside move meanwhile breaking 101.70 will trigger a downside move that might be strong. USD/JPY S&R Chart" title="USD/JPY S&R Chart" width="1363" height="615">
USD/CHF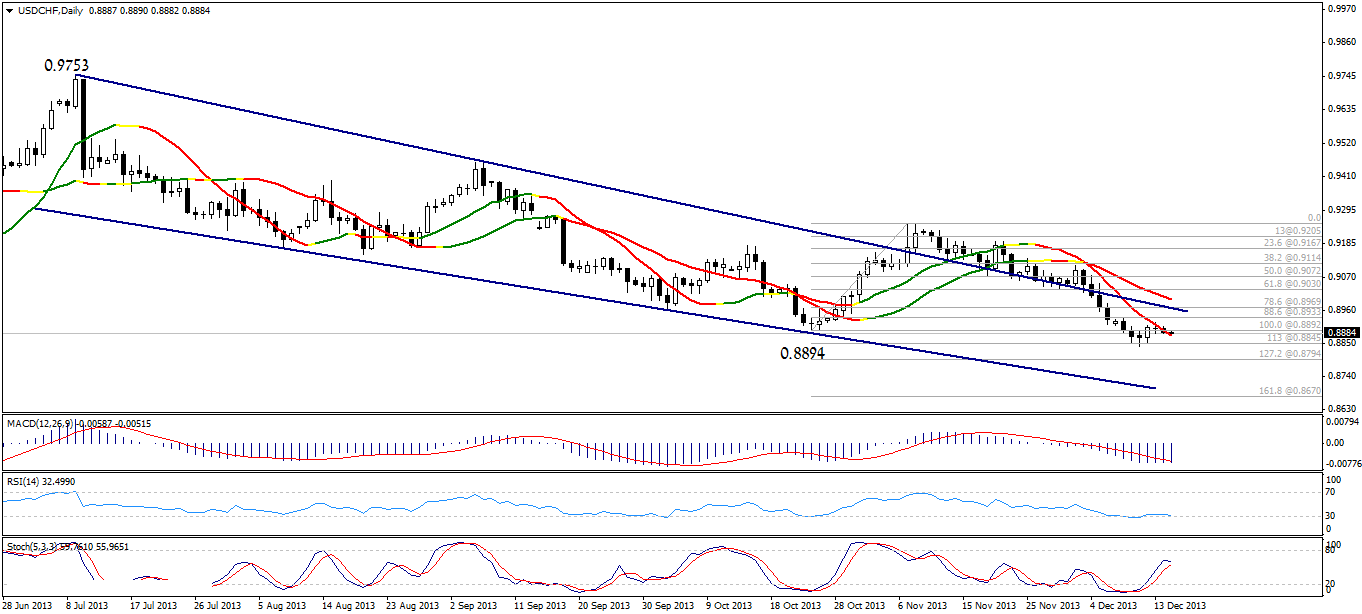 USD/CHF Daily Chart" title="USD/CHF Daily Chart" width="1363" height="615">
The pair adopted a sideways range today and last Friday within the descending channel as shown on graph. While the resistance level dropped with time it approached the pair slowly forcing us to suggest a downside move for this week, which remains valid by stabilizing below 0.8970. Breaking 0.8845 levels support these expectations. USD/CHF S&R Chart" title="USD/CHF S&R Chart" width="1363" height="615">
USD/CAD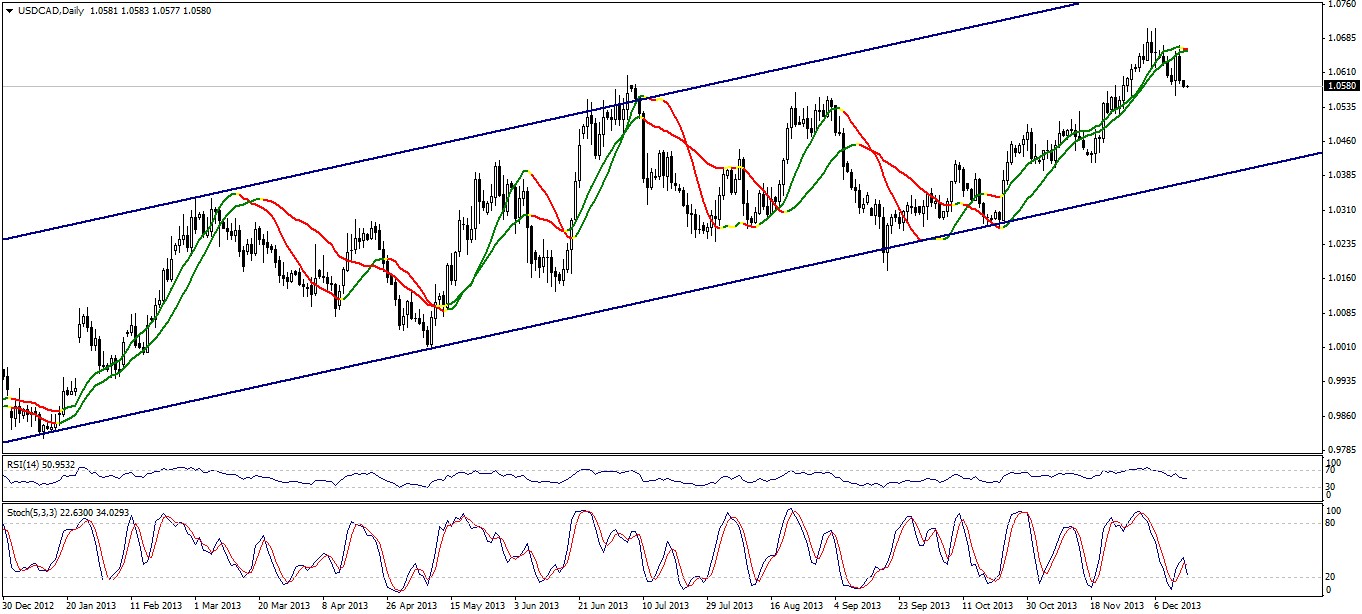 USD/CAD Daily Chart" title="USD/CAD Daily Chart" width="1363" height="615">
The pair failed to stabilize above Linear Regression Indicators last Friday and dropped sharply because of that forming a negative technical formation within the ascending channel. Stability below 1.0660 is intraday negative, as we expect the bearish correction to deepen this week despite that the overall upside move is ongoing. Breaking 1.0555 will support the suggested bearish correction. USD/CAD S&R Chart" title="USD/CAD S&R Chart" width="1363" height="615">
AUD/USD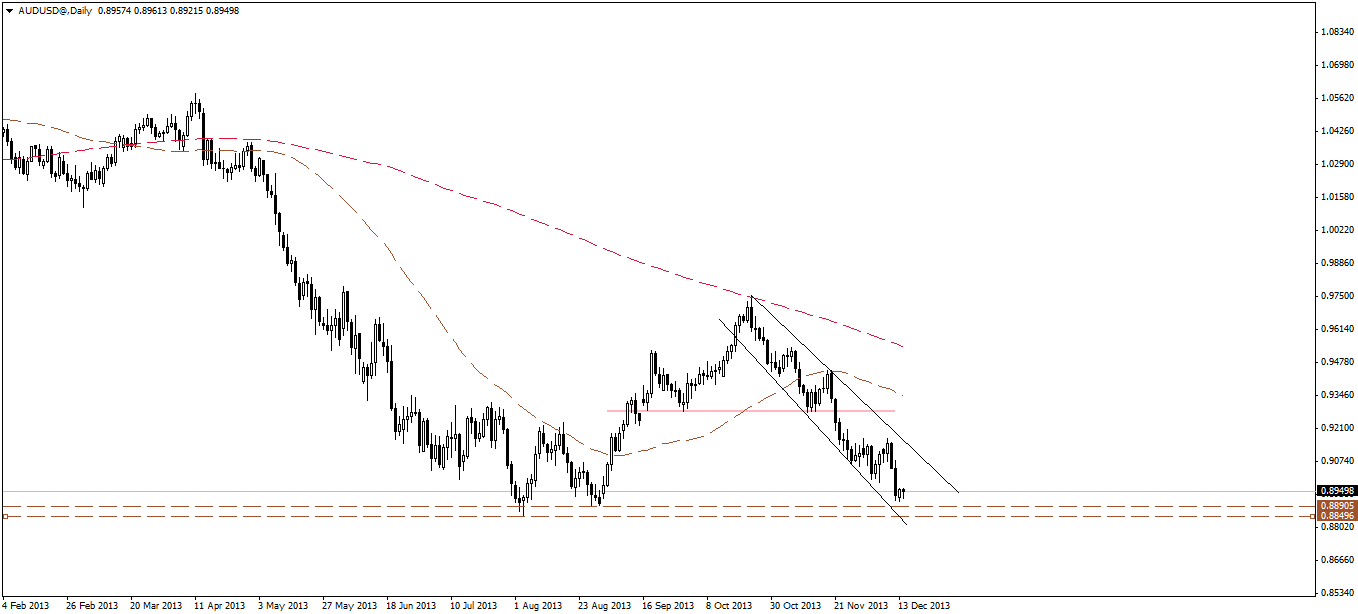 AUD/USD Daily Chart" title="AUD/USD Daily Chart" width="1363" height="615">
The pair retested levels just above the main and major low at 0.8850, where price looks excessively oversold, and therefore, we may see a minor bullish pullback ahead of resuming the overall bearish trend. AUD/USD S&R Chart" title="AUD/USD S&R Chart" width="1363" height="615">
NZD/USD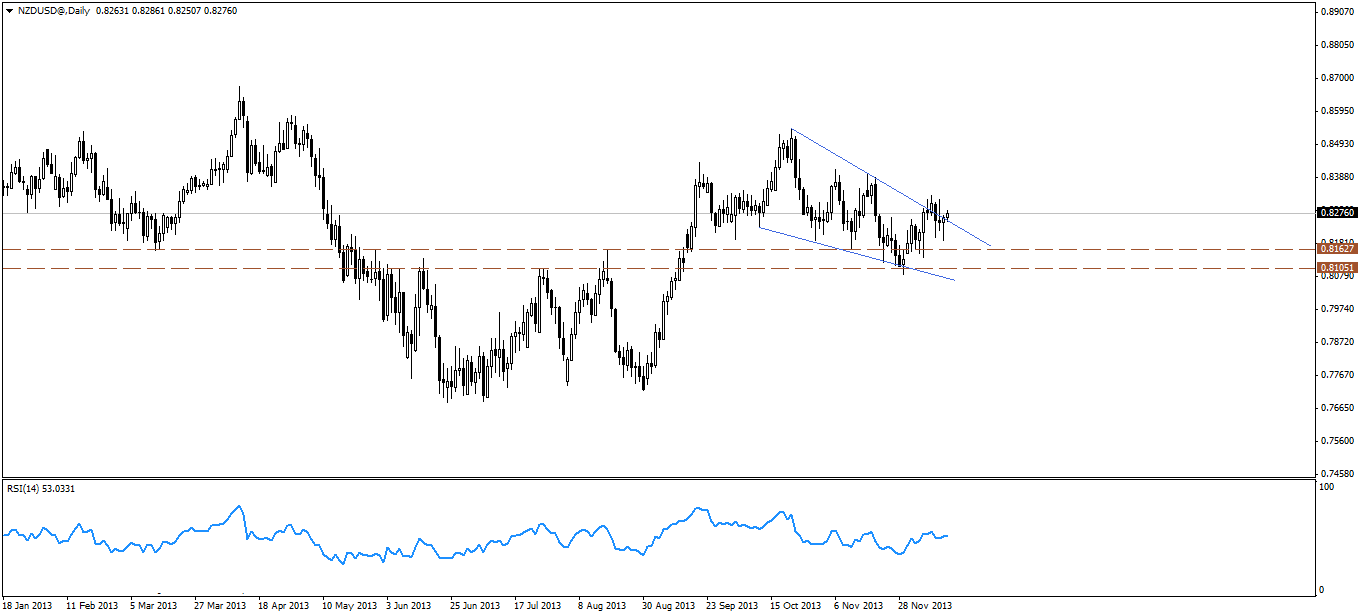 NZD/USD Daily Chart" title="NZD/USD Daily Chart" width="1363" height="615">
The pair maintains the sideways fluctuating stance, hovering around the descending resistance for the falling wedge shown on the daily chart above, we need to see a clear break above this resistance to confirm further upside. NZD/USD S&R Chart" title="NZD/USD S&R Chart" width="1363" height="615">
