I hope everyone had a good weekend and enjoyed the weather (if it was nice like it has been here in Indianapolis). Last week I highlighted another chart that shows the retail sector is getting taken to the wood shed. While retailers had a strong April, traders have continued to increase the divergence in relative performance against the equity market as a whole.
Coffee finished the week down nearly 10%. Two weeks ago I discussed the bearish setup for the commodity that helped lead commodities higher at the start of the year. I’ll be watching to see if the rest of this space begins to follow Coffee’s lead, or if this weakness is able to be contained to one piece of the pie. I got a lot of push back on my coffee post when it got published a TraderPlanet. A couple of people noted the apparently horrible coffee crop in Brazil. I had no idea Brazil had a bad crop, probably because I didn’t care. If something important was happening in Brazil, I assume it’ll show up in the price of Coffee futures.
Equity Trend
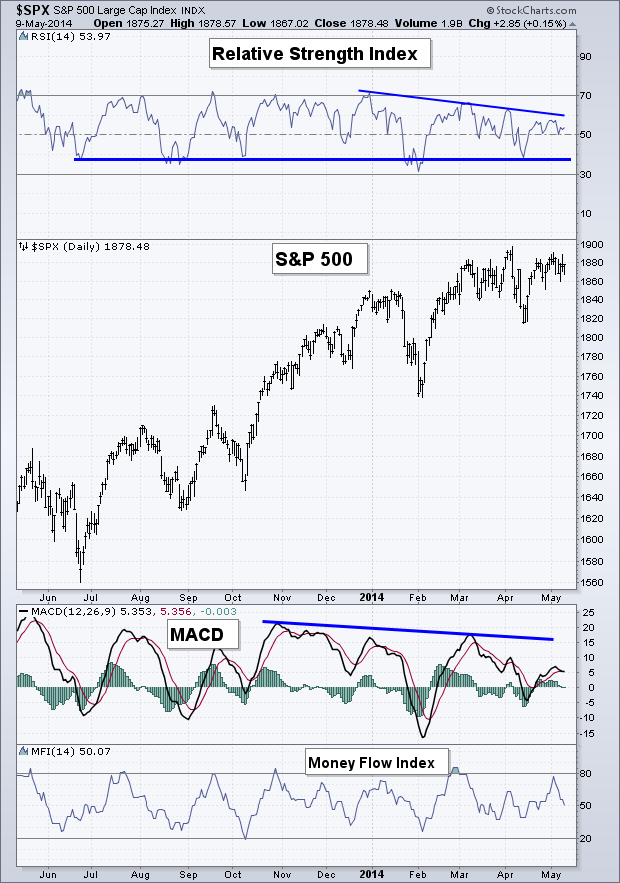
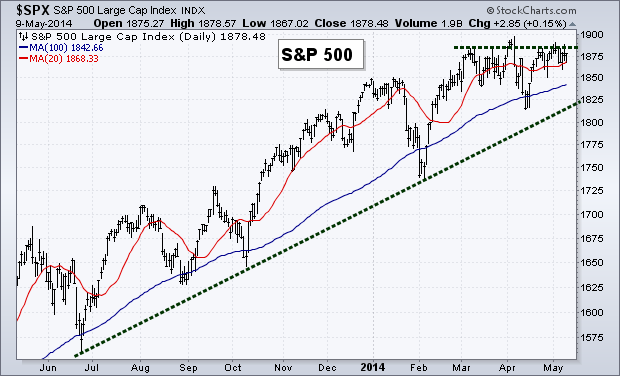
Like the Dow, the S&P 500 (SPX) continues to struggle with its January high. We are starting to see a protracted period of range-bound trading which could be setting up for another leg higher or preparing for a sell-off. While we still have a series of higher highs, the trend is still positive although it’s beginning to weaken with buyers' inability to get the new all-time high they so desperately want.
Equity Breadth
Josh Brown and J.C. Parets both did great posts last week looking at market breadth. Their focus was looking at the number of new 52-week highs on the NYSE. I’ve discussed a similar chart in previous Weekly Technical Market Outlook posts, noting the divergence that’s been taking place for the last several months.
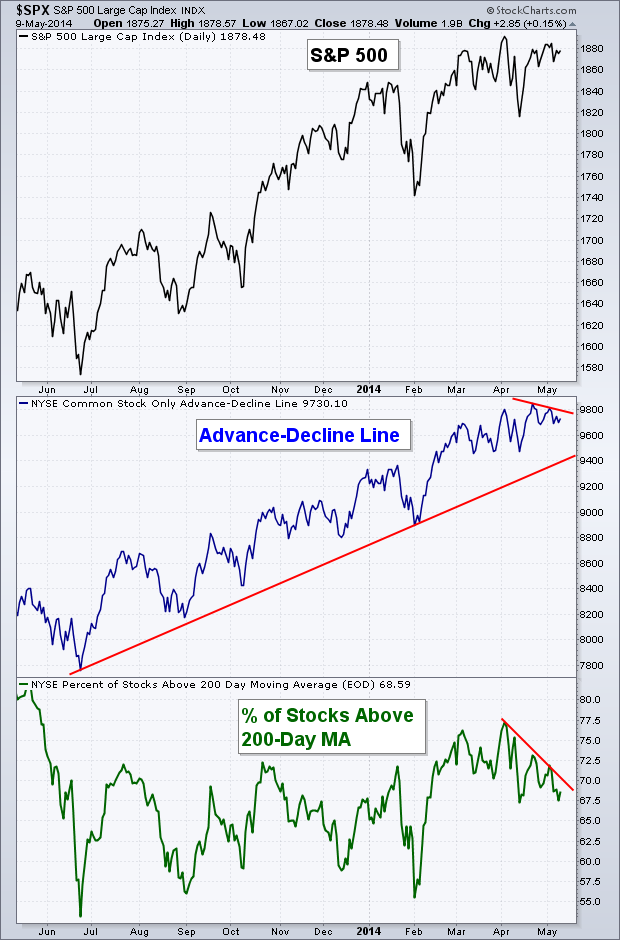
I’ve made a change to the chart I show each week of breadth. Previously I had been showing the NYSE Advance-Decline Line which includes all issues. While this is the more common measure of A-D used, I feel it’s inferior to the Common Stock-Only Advance-Decline Line as it strips out all of the foreign ADRs and bond funds that muck up the broader measure. Going forward I’ll be using the Common Stock-Only measure in order to better show the health of the breadth of the market. So let’s get into it…
We are starting to see a slight negative divergence of lower highs in both measures of breadth – the Advance-Decline Line and the Percentage of Stocks Above Their 200-Day Moving Average. A break of the April low of the A-D line would signal a trend change in the breadth indicator. This is definitely something we don’t want to see happen while the S&P challenges a new high.
Equity Momentum
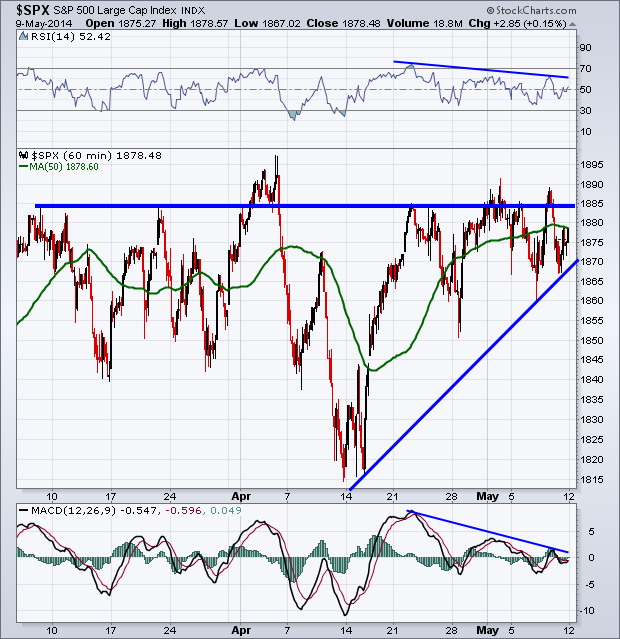
Last week we saw the Relative Strength Index consolidate above its 50 level. This is a short-term bullish sign that while stocks finished the week in the red we still saw momentum hold its mid-point. The overall divergences taking place in the RSI and MACD however are still in place and may start to weigh on S&P 500 if things continue to trade in a range like they have been these past couple of weeks.
Emerging Markets
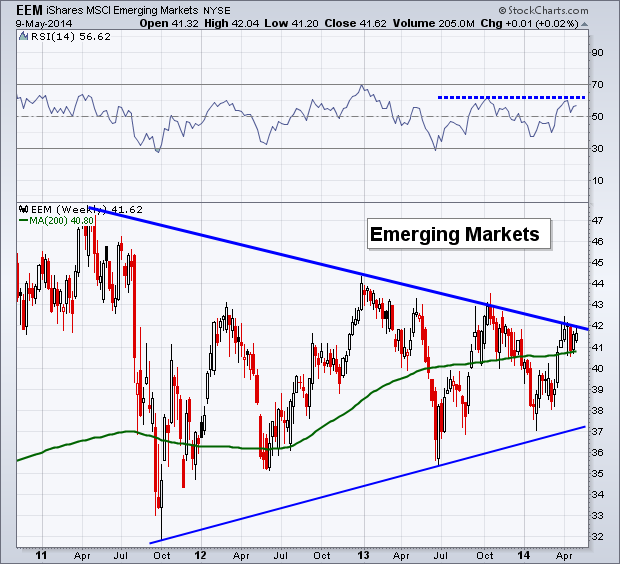
While I often show daily charts on my blog and in this weekly post, below is a weekly chart of the iShares Emerging Markets ETF (EEM). I last showed this chart in October last year as this emerging markets ETF was approaching resistance and six days it topped out. Well we are now back at this long-term trend line in price as well as momentum.
EEM has been seeing lower highs on a weekly basis since 2011, and while price has also provided some strong rallies, this long-term down trend has been unable to break. The RSI indicator is also bumping up against its October ’13 high. I’ll be watching to see if buyers can push past this trend line and get momentum to break above the 60 level, or if price retreats and eventually drops under its 200-week Moving Average which has acted as nice support over the last month.
Looking at the intraday price movement of the S&P we can see the divergences in momentum (both RSI and MACD) are still intact as the index battles the 1885 level. While price has put in a series of higher lows, it’s been unable to follow them up with any higher highs.
Last Week’s Sector Performance
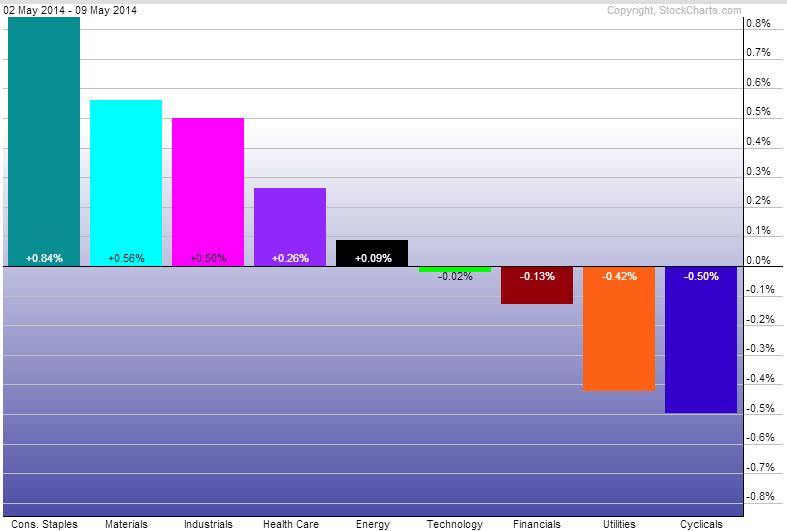
Utilities (XLU) which has been the star-child of 2014, saw it second week of being in the red in relative performance against the S&P 500. Although it did not under-perform the Consumer Discretionary sector (XLY) which while showing a bit of strength last week, continues to be one of the worst performers each week. On the flip side, Consumer Staples (XLP) lead the pack last week, followed by Materials (XLB) and Industrials (XLI)
Year-to-Date Sector Performance
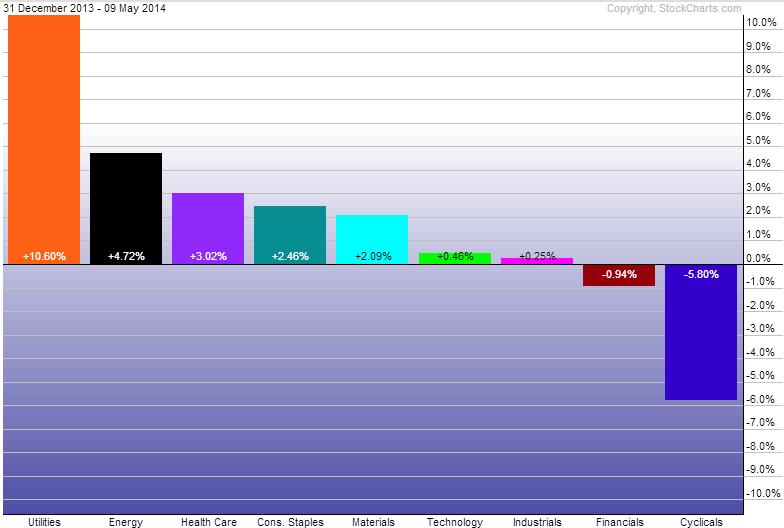
Although Utilities have not had a great past two weeks, they continue to lead YTD. Energy (XLE) and Health Care (XLV) also have continued to see strong relative performance. With Industrials strong performance last week, we now only have two sectors under-performing the market so far this year: Financials (XLF) and Consumer Discretionary.
This week we get two sets of inflation data (PPI and CPI) as well as another set of retail data. I’ll be watching to see if the retail space picks back up on any signs of continued strength in the retail data.

