Investing.com’s stocks of the week
The row with VW (OTC:VLKPY) automobiles where special gadgets were understating the emissions has caused the increased volatility on the precious metals market. The platinum used in catalysts for diesel engines saw its prices to go down, while palladium prices went up. It is used in the catalysts for petrol engines. Gold prices are inside the triangle. How long will the neutral trend last?
Palladium is gaining momentum as investors are expecting the higher demand for the petrol powered automobiles and the lower demand for the diesel powered ones where platinum is used. It’s tough to tell so far whether it makes sense, so let’s switch to the gold chart.
Theoretically, it can be used in the automotive catalysts, but those technologies are under development. About two thirds of the extracted gold goes towards investments and jewelry with only 10% used for manufacturing purposes. Gold as an investment asset counters the US dollar and their movements are oppositely directed.
For the past two months global gold prices were quite stable hovering near the five-year low. This encouraged its import to India, which is the major buyer of gold after China. In August, imports increased by 140% compared with the same period of the previous year to reach $4.96 bln. In July it advanced 62% to $2.97 bln. Now it is hard to predict the future gold dynamics on the basis of the fundamentals.
For instance, India Bullion and Jewellers Association expects gold imports to contract by 10% this year in case of drought as 10% of jewelry buyers live in the countryside with their income largely depending on crops. Instead, the World Gold Council predicts the 3-9% import growth to India stating that the country’s FX reserves have grown by 10% to $351bln. since the start of the year.
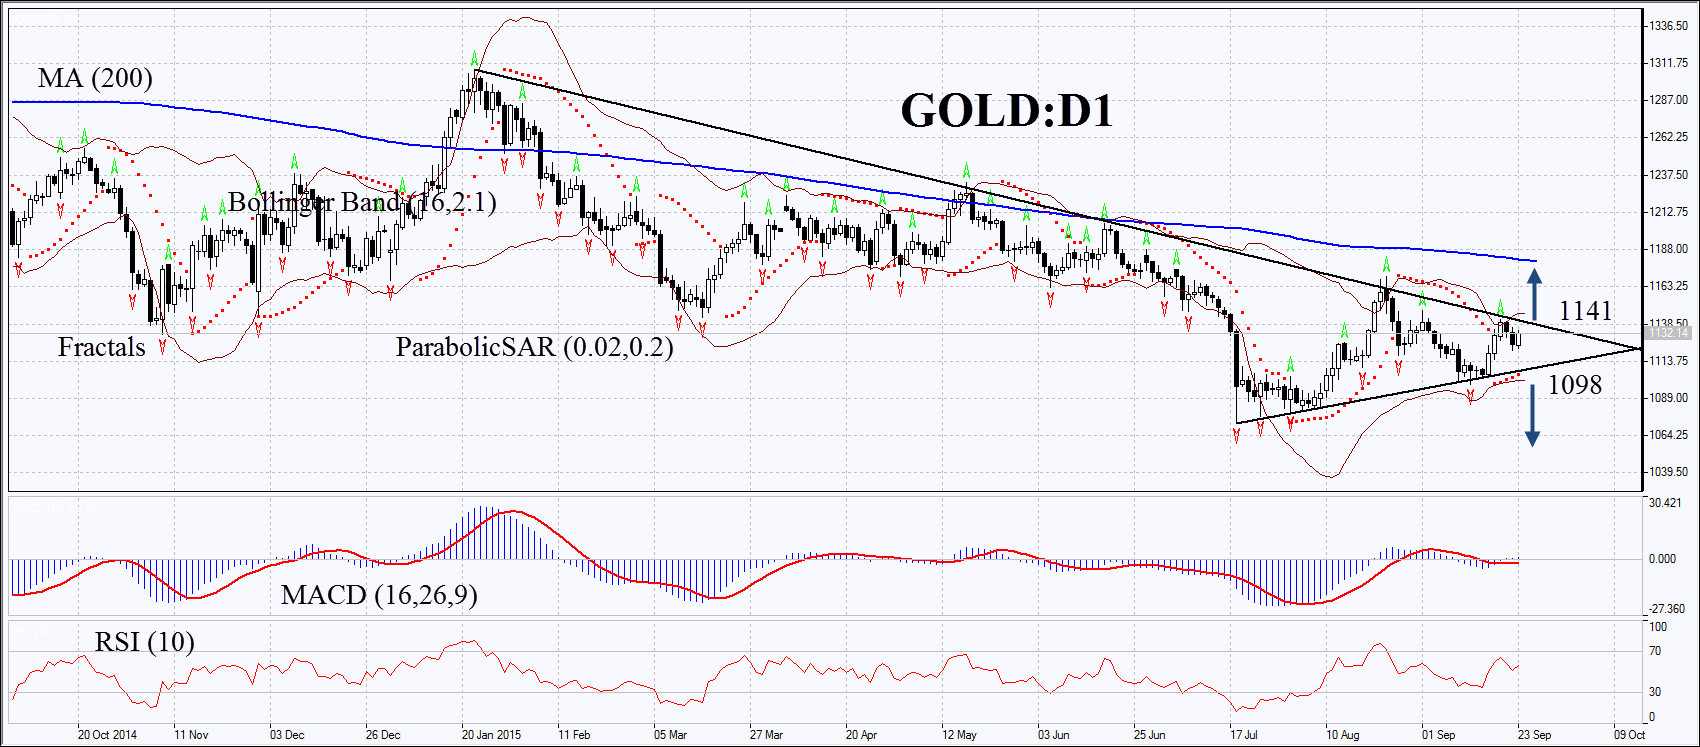
On the daily chart, gold is in the downtrend since the start of the year. Now the prices are struggling for growth within the triangle. They are below the 200-day moving average. The MACD and Parabolic indicators show the buy signals. RSI is neutral and above 50. The Bollinger Bands® have contracted which may mean lower volatility. We assume the momentum may form after surpassing the fractal high of 1141 or in case of decline below the Parabolic signal and the lower Bollinger Band of 1098.
Let the market choose the direction. Two or more positions can be placed symmetrically. After opening one of the orders the second can be deleted as the market has chosen the direction. Having opened the delayed order we shall move the stop to the next fractal high (short position) or fractal low (long position) following the Parabolic signal every four hours.
The most risk-averse traders may switch to the 4-hour chart after the trade and place there a stop-loss moving it in the direction of the trade. By doing this we adjust the potential profit/loss ratio in our favour. If the price meets the stop-loss level without reaching the order, we recommend cancelling the position: the market sustains internal changes which were not taken into account.
- Position Sell
- Sell stop below 1098
- Stop loss above 1141
- Position Buy
- Buy stop above 1141
- Stop loss below 1098
