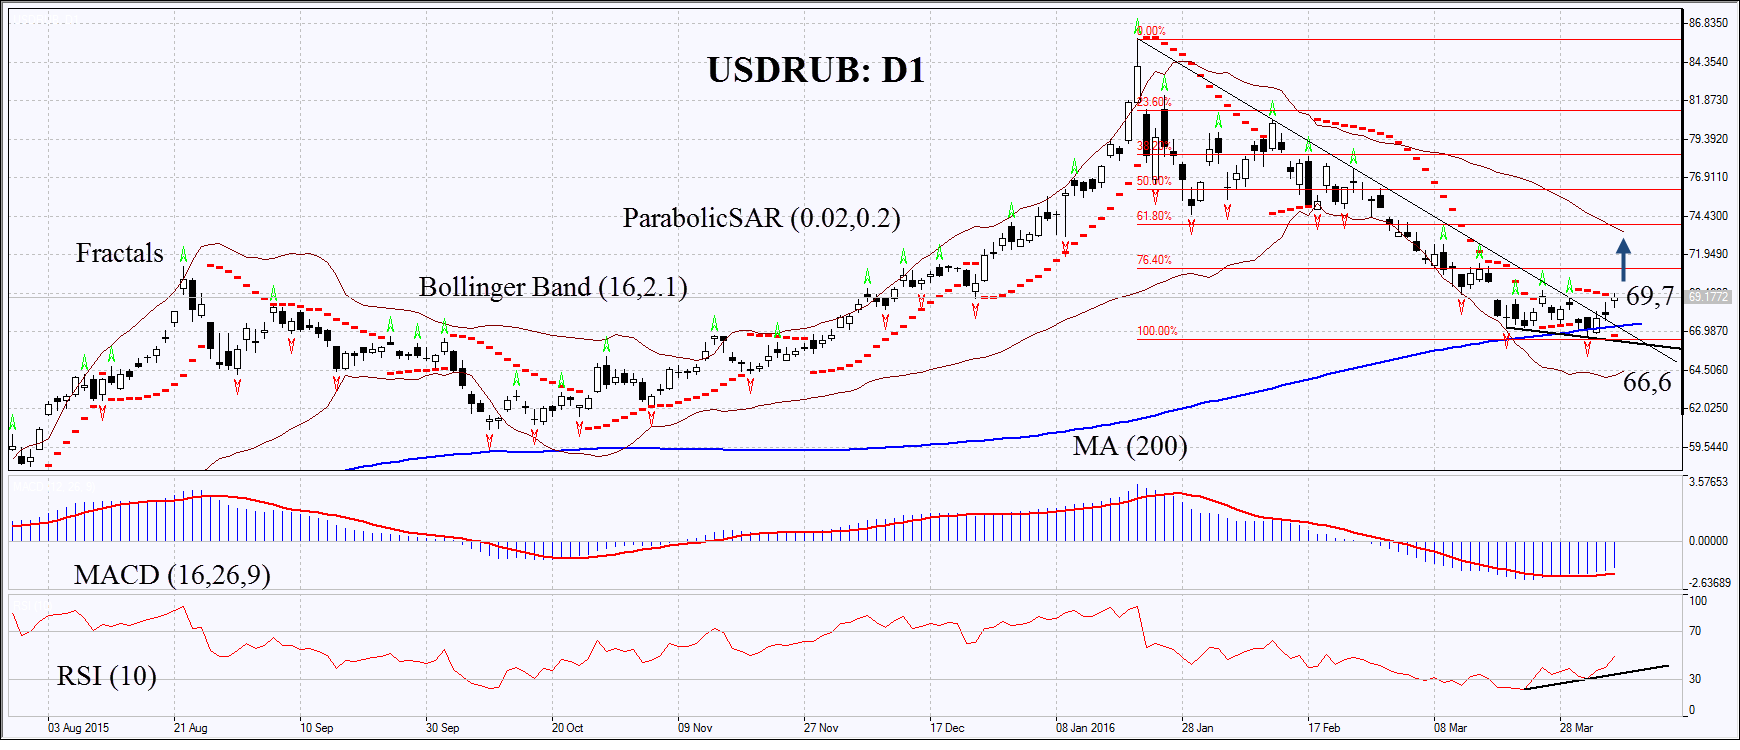
The dependence of the Russian ruble on international oil prices decreased though it has not disappeared completely. Ruble becomes cheaper due to the ongoing Brent quotations fall. Such trend on USD/RUB chart looks like a growth. Will the weakening of the ruble continue? It should be noted that since early April Brent oil fell by 6%, while the Russian currency had lost only 3%.
Share of energy products in the structure of Russian exports to non-CIS countries fell from 73.4% in 2014 to 66.4% in 2015. Share of hydrocarbon supplies has decreased to 39.5% from 43.6% for the CIS countries. We believe that this is a significant factor in reducing the volatility of the Russian currency fluctuations. An additional factor of stability became quite good macroeconomic indicators. Inflation in Russia in March fell to 7.3% in annual terms compared with 8.1% in February. The fall in GDP in the 4th quarter of 2015 slowed to -3.8% from -4.1%. As a negative factor for the ruble we should note a possible reduction in the positive balance of payments surplus. The volume of imports in Russia stabilized more or less and slowed the decline. Although the volume of exports remains at a low level because of cheap oil and other raw materials. This trend in January-February 2016 caused the reduction of the external surplus of the Russian Federation to $ 9.7 billion from $ 19.4 billion during the same period last year. This happened in spite of a significant decline in the export of capital during first 2 months in the amount of $ 5.9 billion against $ 29.2 billion for January-February 2015. The publication of next data on Russian foreign trade is expected on April 11. On April 14th the information on the volume of foreign exchange reserves of the Central Bank of the Russian Federation will be released. We believe that an important factor in the decline of world oil prices can become not only an excess of supply but also the possible reduction in demand. According to EIA data the demand for gasoline in the US fell in January for the first time during 14 months. A possible slowdown in the global and US economies can significantly increase the risks for the oil-exporting countries. On the 17th of April OPEC and independent producers are going to discuss the possibility of "freezing" of oil production.

On the daily time frame USD RUB: D1 could not break down the 200-day moving average line and passed from the falling trend in neutral. Indicator MACD and Parabolic formed buy signals. The RSI is increasing and approached the level of 50. It formed an upward divergence. Lines Bollinger narrowed, which means a decrease in volatility. We do not exclude bullish movement if the exchange rate will exceed the last two upper fractals and Parabolic signal: 69,7. This level can be used as an entry point. The initial restriction of risk may be set lower than the last fractal, Parabolic signal, and 200-day moving average line: 66.6. After the opening of a pending order we shall move the stop signal following Bollinger® and Parabolic to the next fractal low. Thus we are changing the potential ratio of profit / loss in our favor. The most cautious traders can move to a 4H chart and set the stop-loss following the direction of the price. If the price overcomes the stop level (66.6) without activating order (69.7) it is recommended to remove the position: the market internal changes occur that were not taken into account
Position Buy Buy stop above 69,7 Stop loss below 66,6
