Cryptocurrencies have proven to be a highly promising investment and trading vehicle during 2018. With stock prices that increased by up to four-digit percentages and the increasing interest in blockchain adoption around the globe, the blockchain industry can be considered as one of the most promising in the world. In this technical analysis series, I aim to provide an outlook on three of the most relevant cryptocurrencies.
With the total market cap of all the cryptocurrencies declining by more than 80 percent, the top ten coins weren’t spared. While Stellar Lumens dropped by 82 percent to date, and Waves even by 95 percent, the current outlook gives hope for a short-term correction of the price movement.
WAVES/USD DAILY
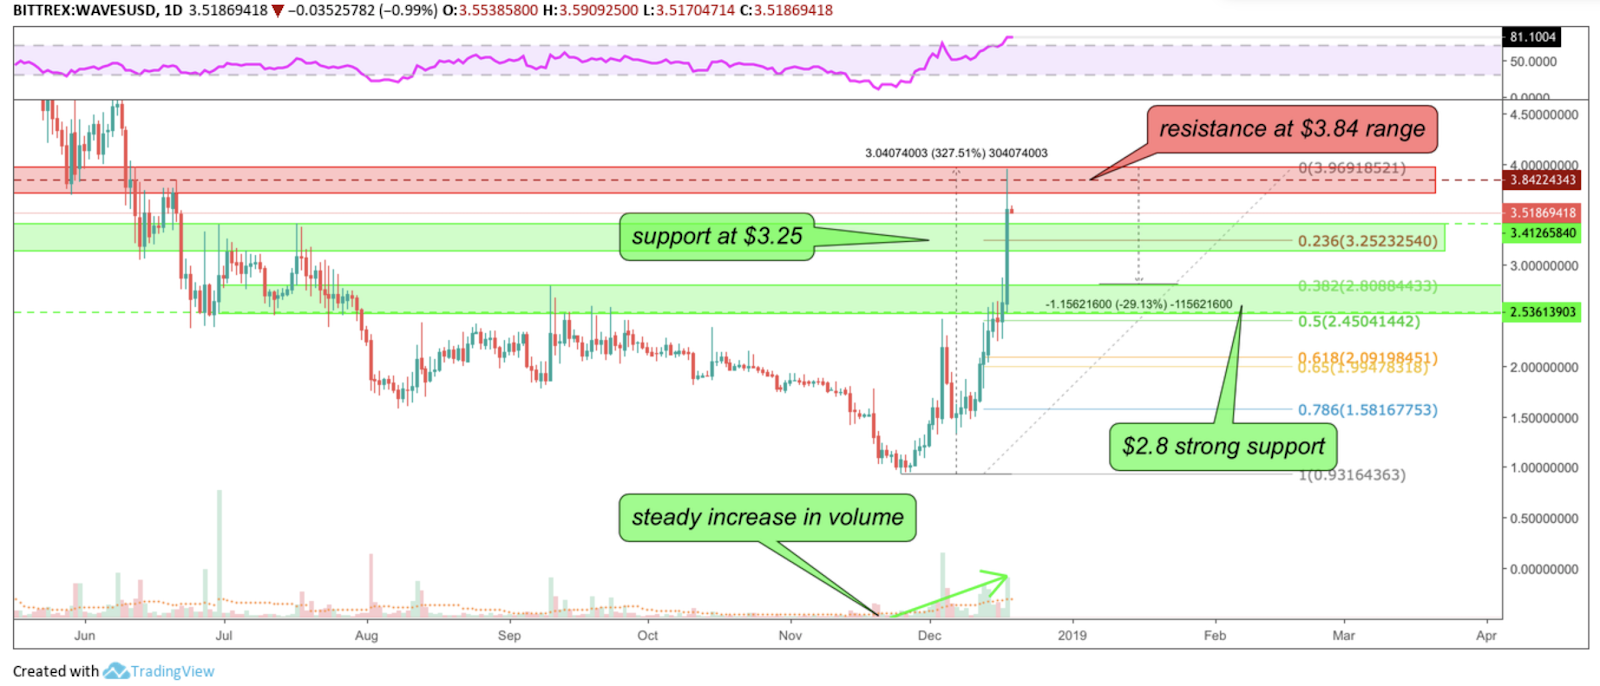
Waves surged an incredible 327.51 percent during December and is currently facing resistance at around $3.84. With the current outlook, it might find support at $3.25 where the 0.236 fib level sits. If not, it will most likely decline by 29 percent to $2.8 where it will find additional support and where it will most likely bounce off to the 0.382 fib level. A bounce off that zone would be a very bullish sign and indicating further movement towards the upside. With the steady increase in volume, prospects are quite bullish for Waves at the moment. However, with the Relative Strength Index (RSI) indicating overbought regions, a retracement to $2.8 seems likely.
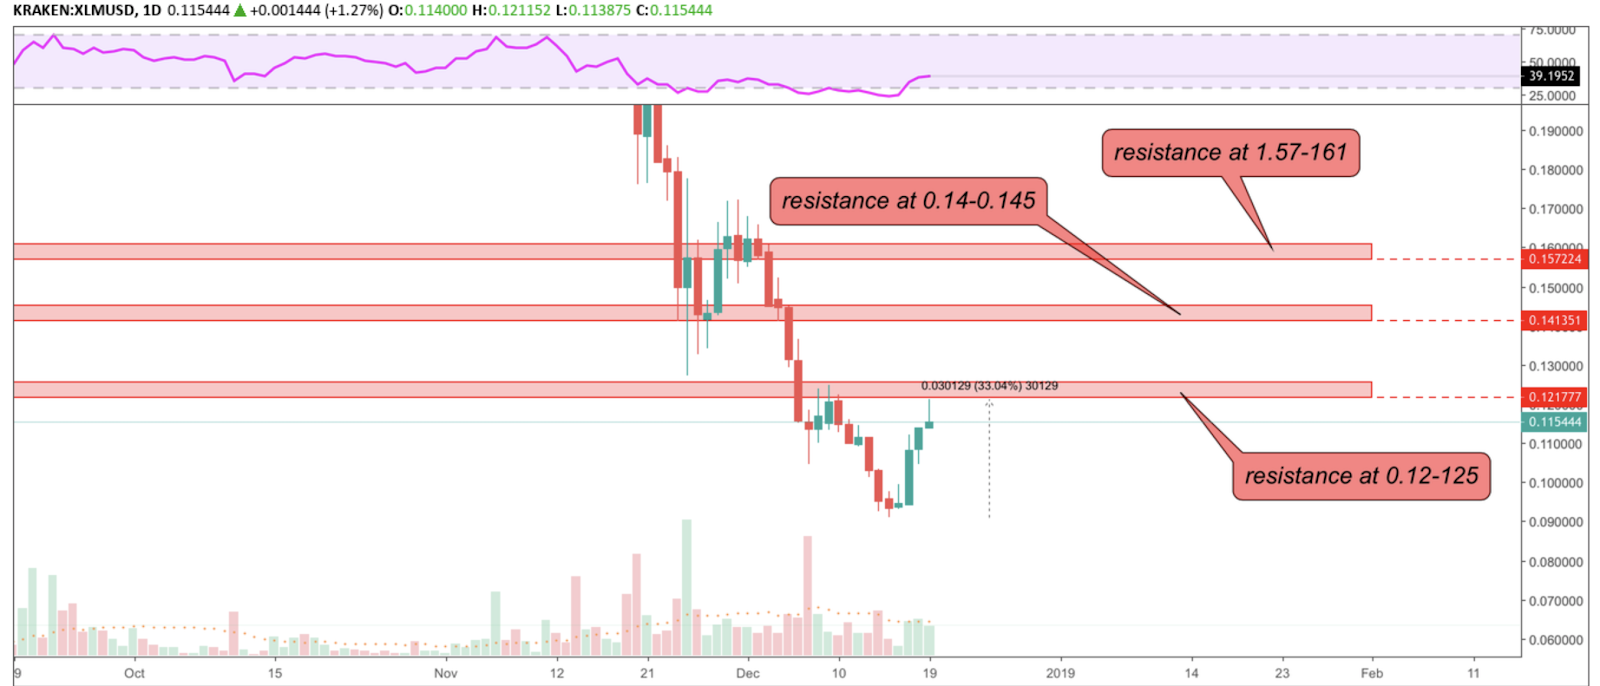
Stellar Lumens had a fantastic week with a price increase of more than 33 percent. It recently faced rejection at the resistance between $0.12 and $0.125. While the RSI still has plenty of room to go up with it currently sitting at 39 points, the next resistance will be faced between $0.14 and $0.145.
XLM/USD
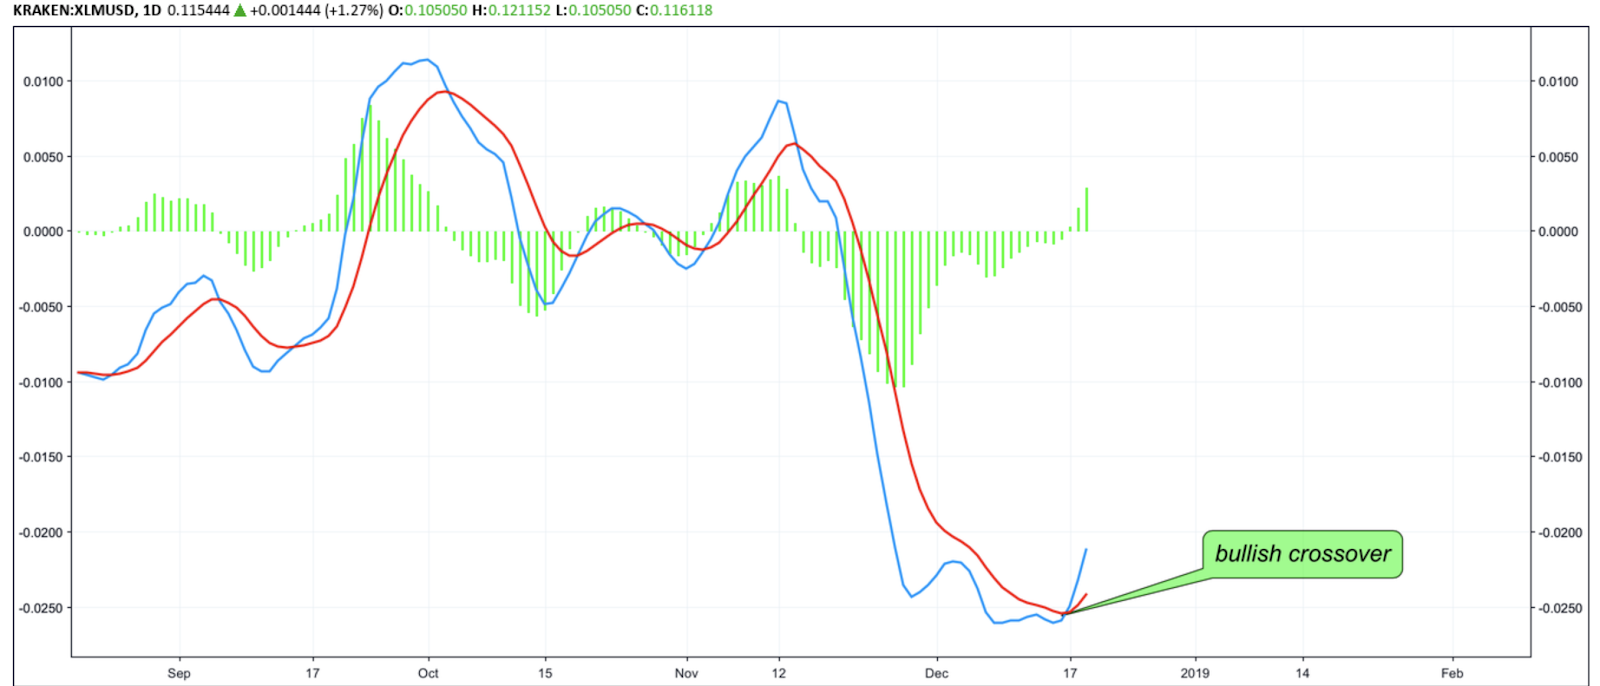
The Moving Average Convergence Divergence (MACD) performed a bullish crossover and because it is located in such low regions, there is still plenty of room to the upside. Additionally, the histogram is ticking higher which indicates further bullish momentum.
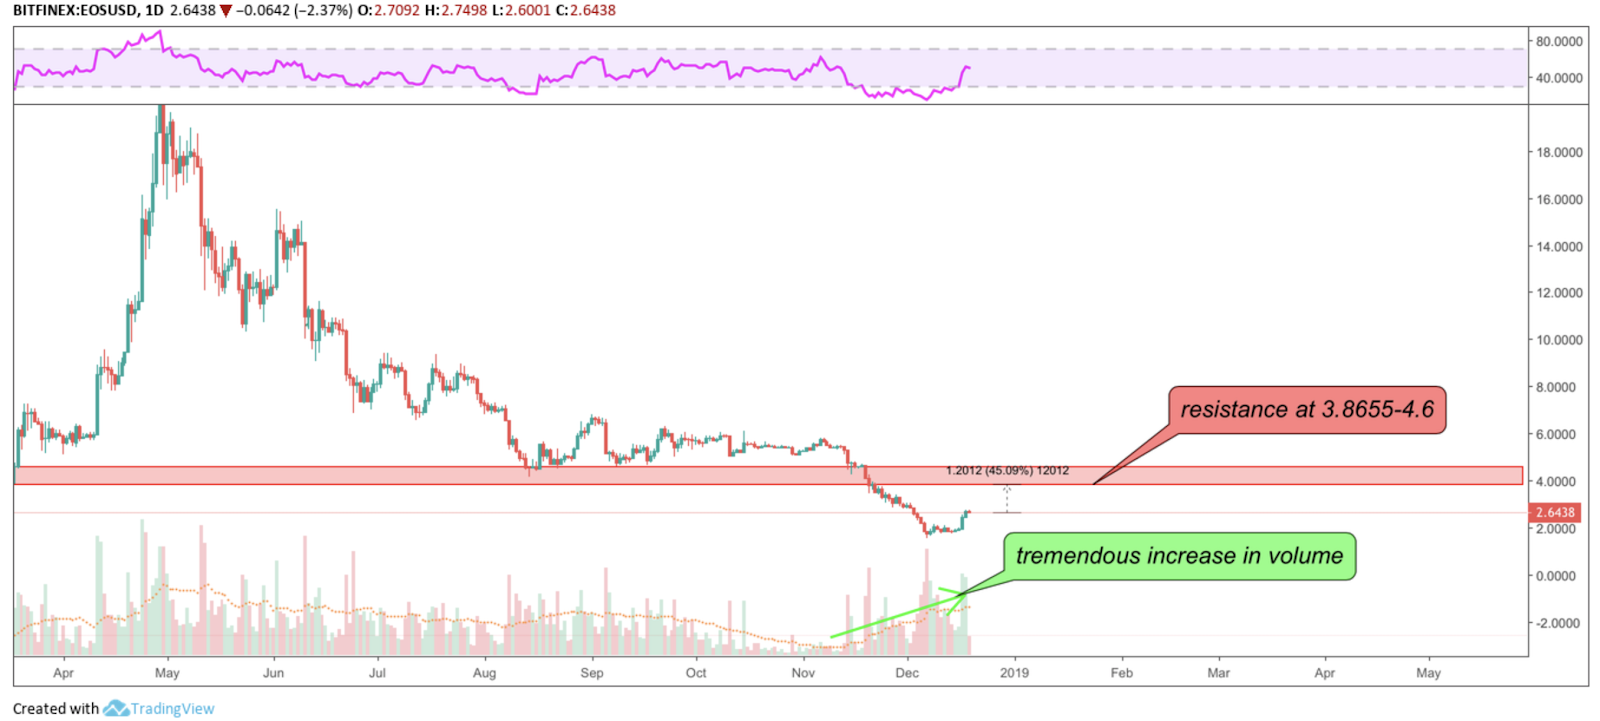
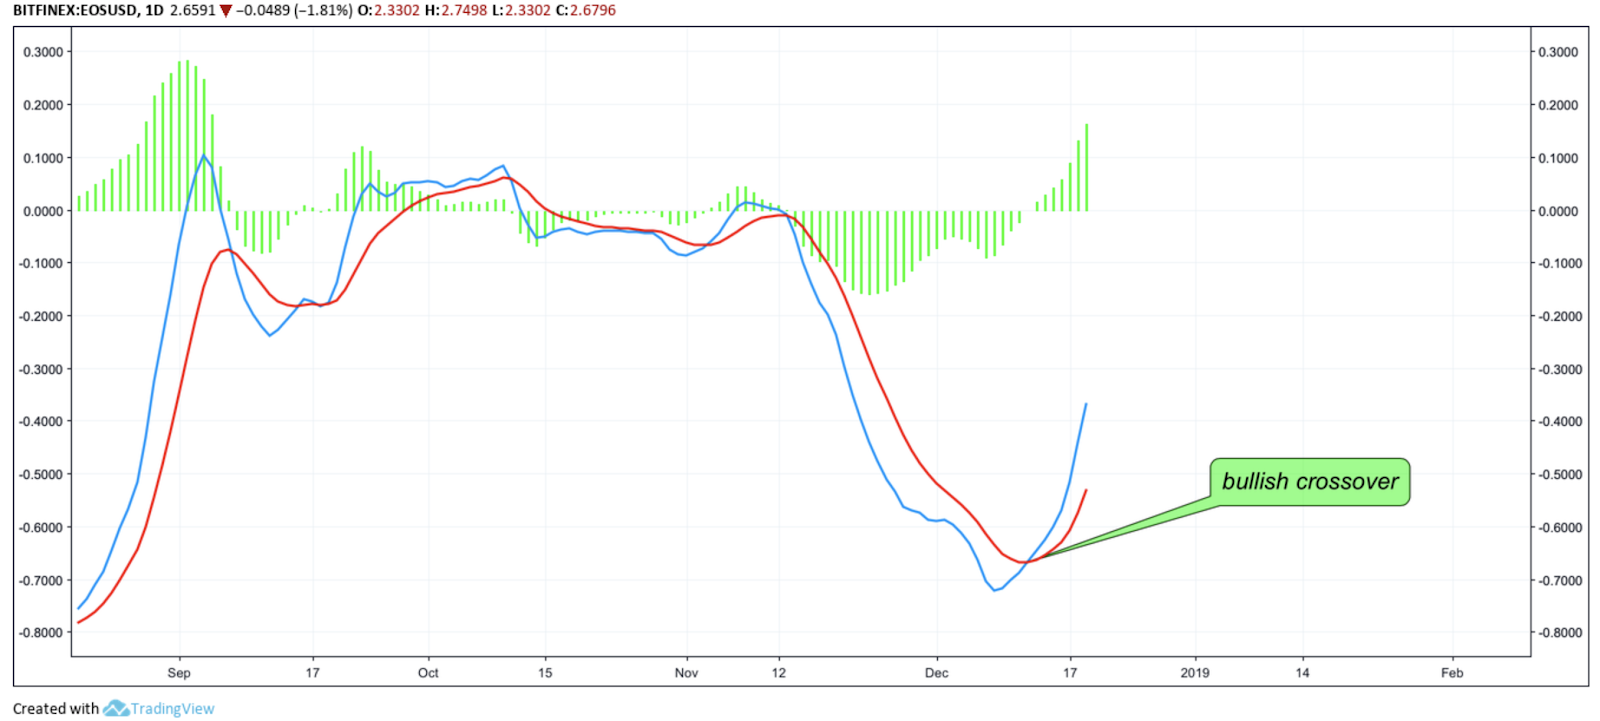
EOS picked up tremendously in volume during the winter months November and December. While it already increased by 74 percent since its all-time-low on December 7, it still has to grow another 45 percent until it will face a resistance between $3.865 and $4.6. The RSI is in the middle of nowhere and indicates neither bullish nor bearish momentum.
EOS/USD
The MACD performed a bullish crossover and, with it being located in such low regions, there is still plenty of room to the upside. The histogram is ticking higher which indicates further bullish momentum.
A correction wave to the upside seems very likely.

