*All the charts are 30M charts with daily pivot points.
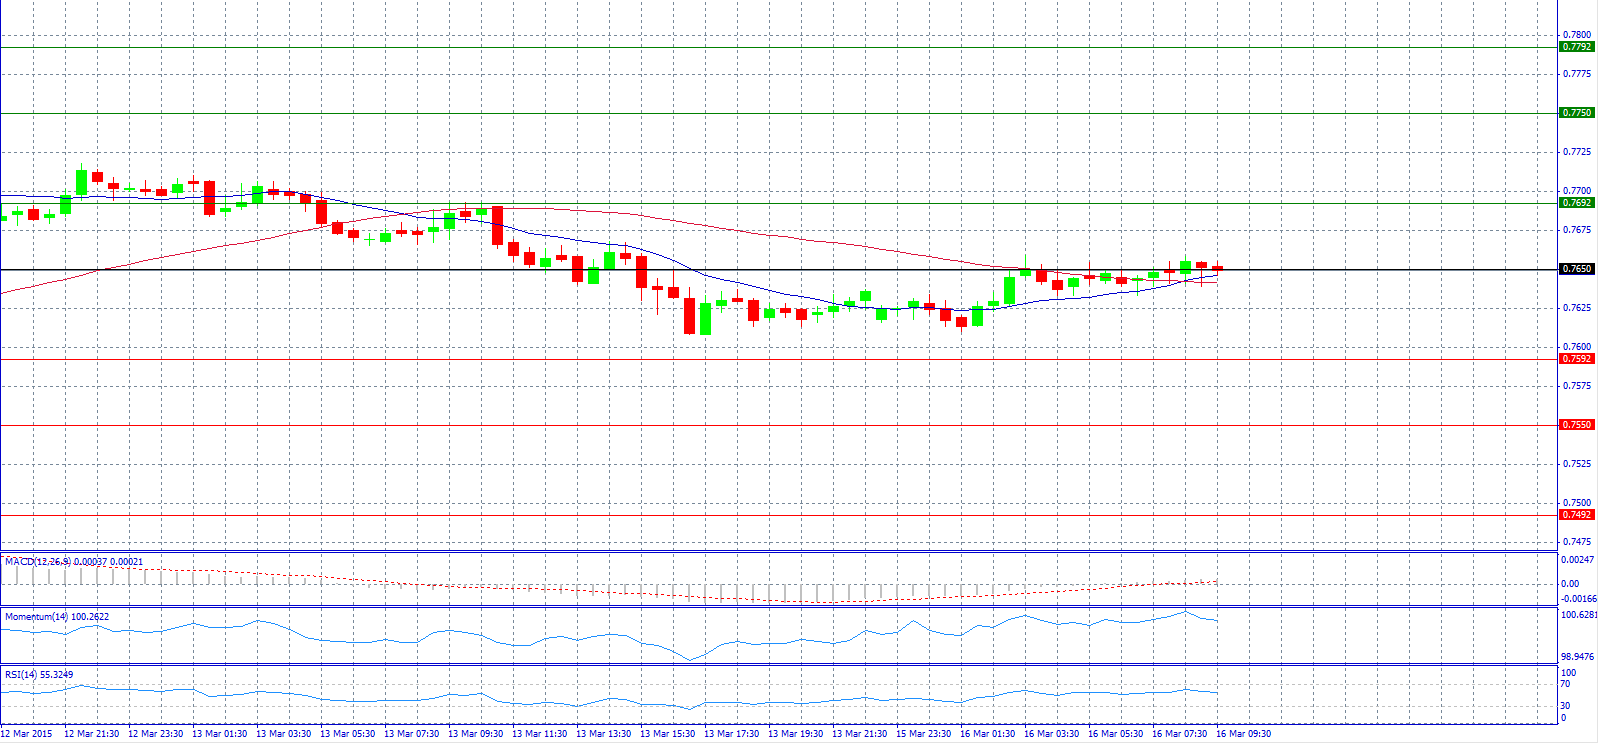
Market Scenario 1: Long positions above 0.7650 with target @ 0.7692.
Market Scenario 2: Short positions below 0.7650 with target @ 0.7592.
Comment: The pair trades near pivot point 0.7650.
Supports and Resistances:
R3 0.7792
R2 0.7750
R1 0.7692
PP 0.7650
S1 0.7592
S2 0.7550
S3 0.7492
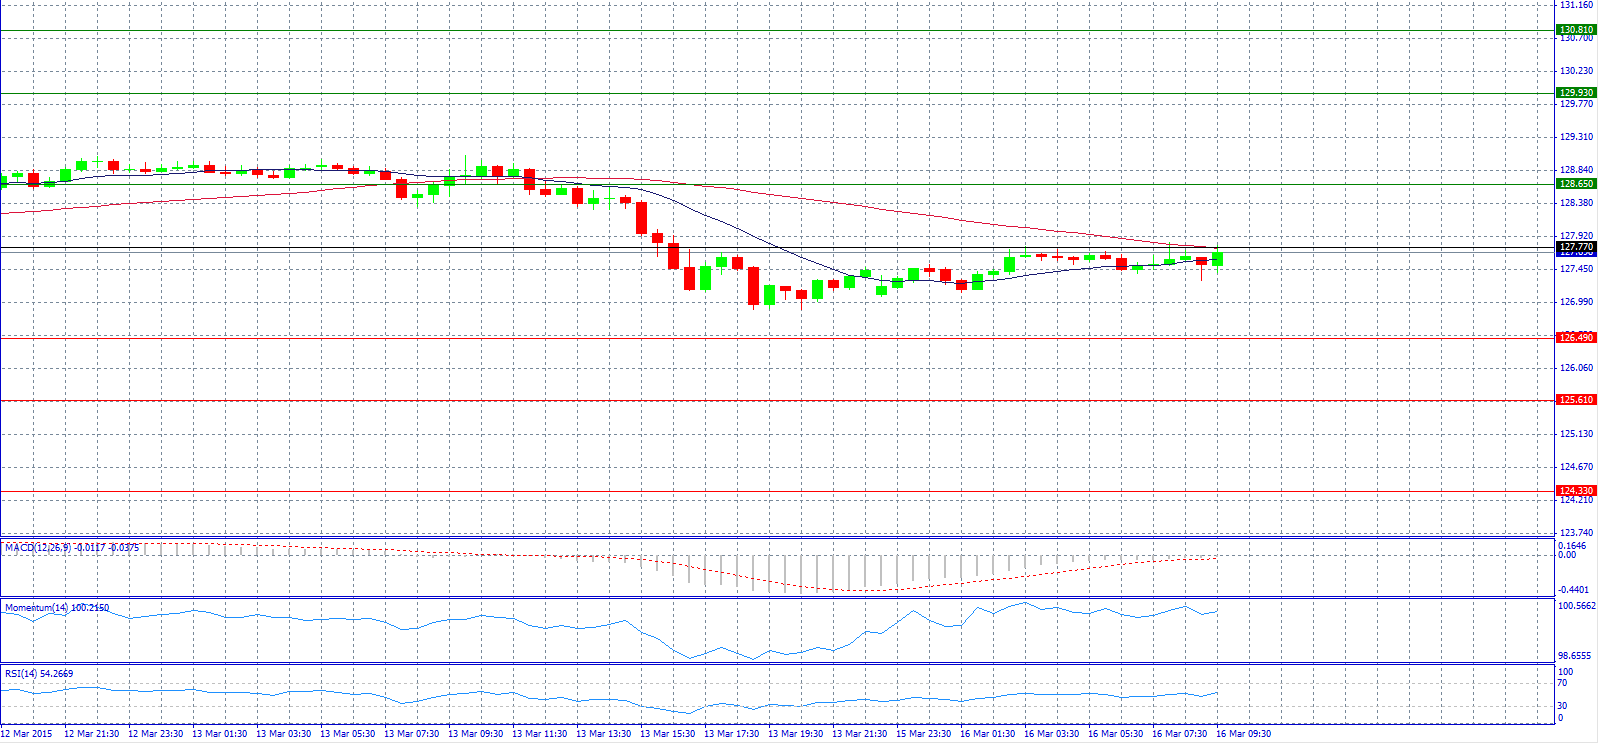
Market Scenario 1: Long positions above 127.77 with target @ 128.65.
Market Scenario 2: Short positions below 127.77 with target @ 126.49.
Comment: The pair remains below 128.00 level.
Supports and Resistances:
R3 130.81
R2 129.93
R1 128.65
PP 127.77
S1 126.49
S2 125.61
S3 124.33
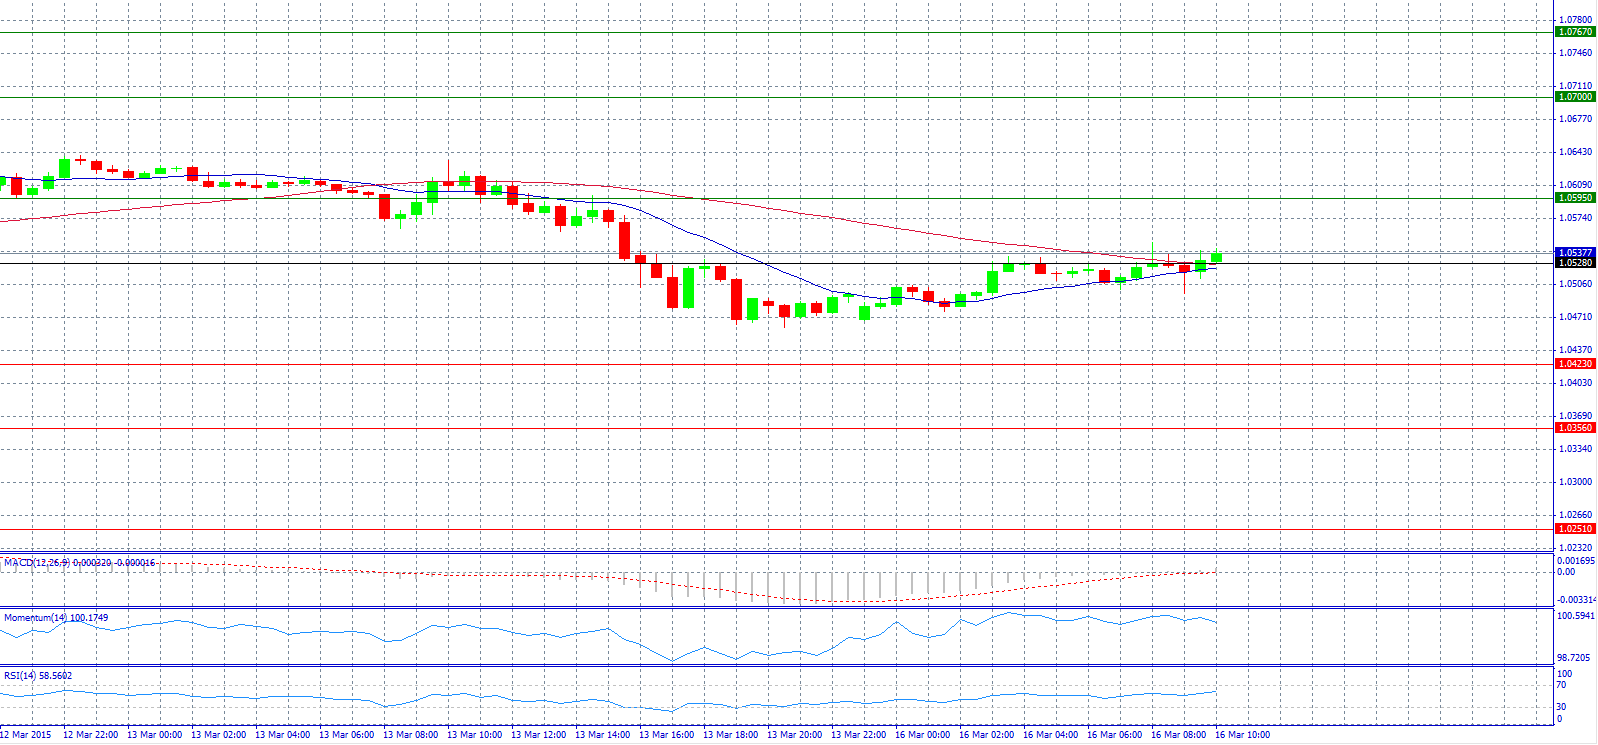
Market Scenario 1: Long positions above 1.0528 with target @ 1.0595.
Market Scenario 2: Short positions below 1.0528 with target @ 1.0423.
Comment: The pair slips to a fresh 12-year low of 1.0457 early, but then rebounds to a 1.0547 high.
Supports and Resistances:
R3 1.0767
R2 1.0700
R1 1.0595
PP 1.0528
S1 1.0423
S2 1.0356
S3 1.0251
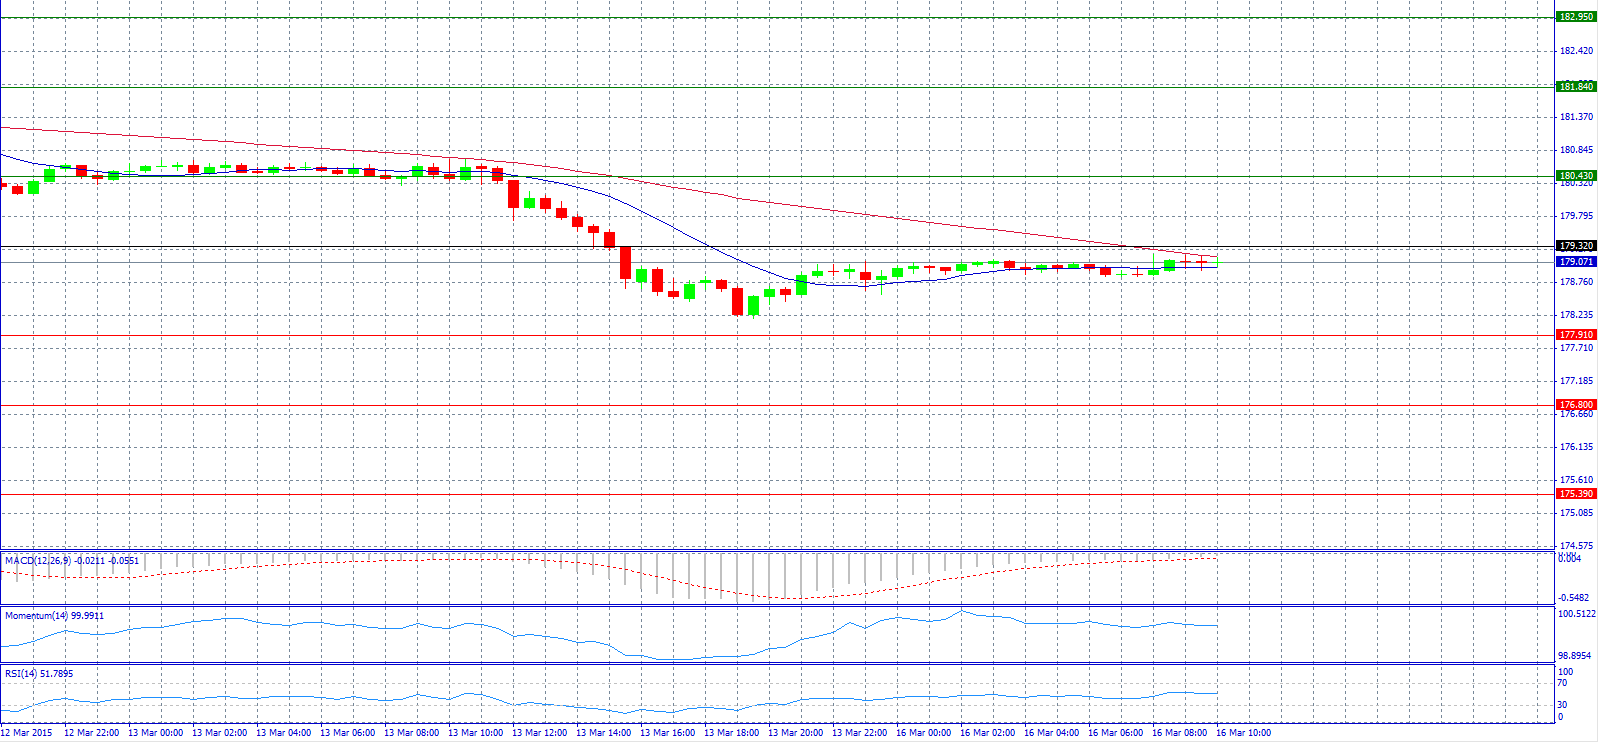
Market Scenario 1: Long positions above 179.32 with target @ 180.43.
Market Scenario 2: Short positions below 179.32 with target @ 177.91.
Comment: The pair seems to trade steady below pivot point 179.32.
Supports and Resistances:
R3 182.95
R2 181.84
R1 180.43
PP 179.32
S1 177.91
S2 176.80
S3 175.39
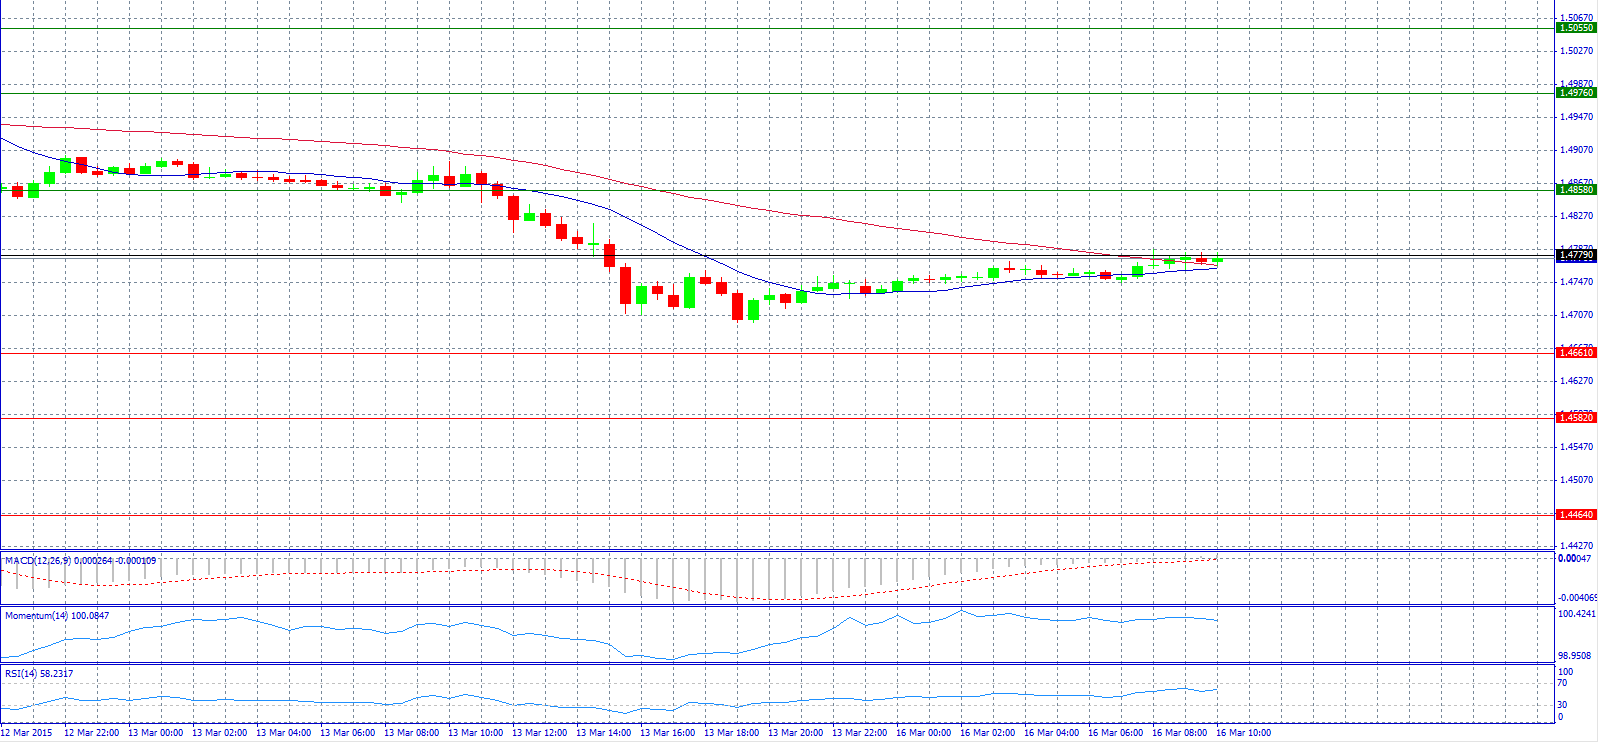
Market Scenario 1: Long positions above 1.4779 with target @ 1.4858.
Market Scenario 2: Short positions below 1.4779 with target @ 1.4661.
Comment: The pair trades near pivot point 1.4779.
Supports and Resistances:
R3 1.5055
R2 1.4976
R1 1.4858
PP 1.4779
S1 1.4661
S2 1.4582
S3 1.4464
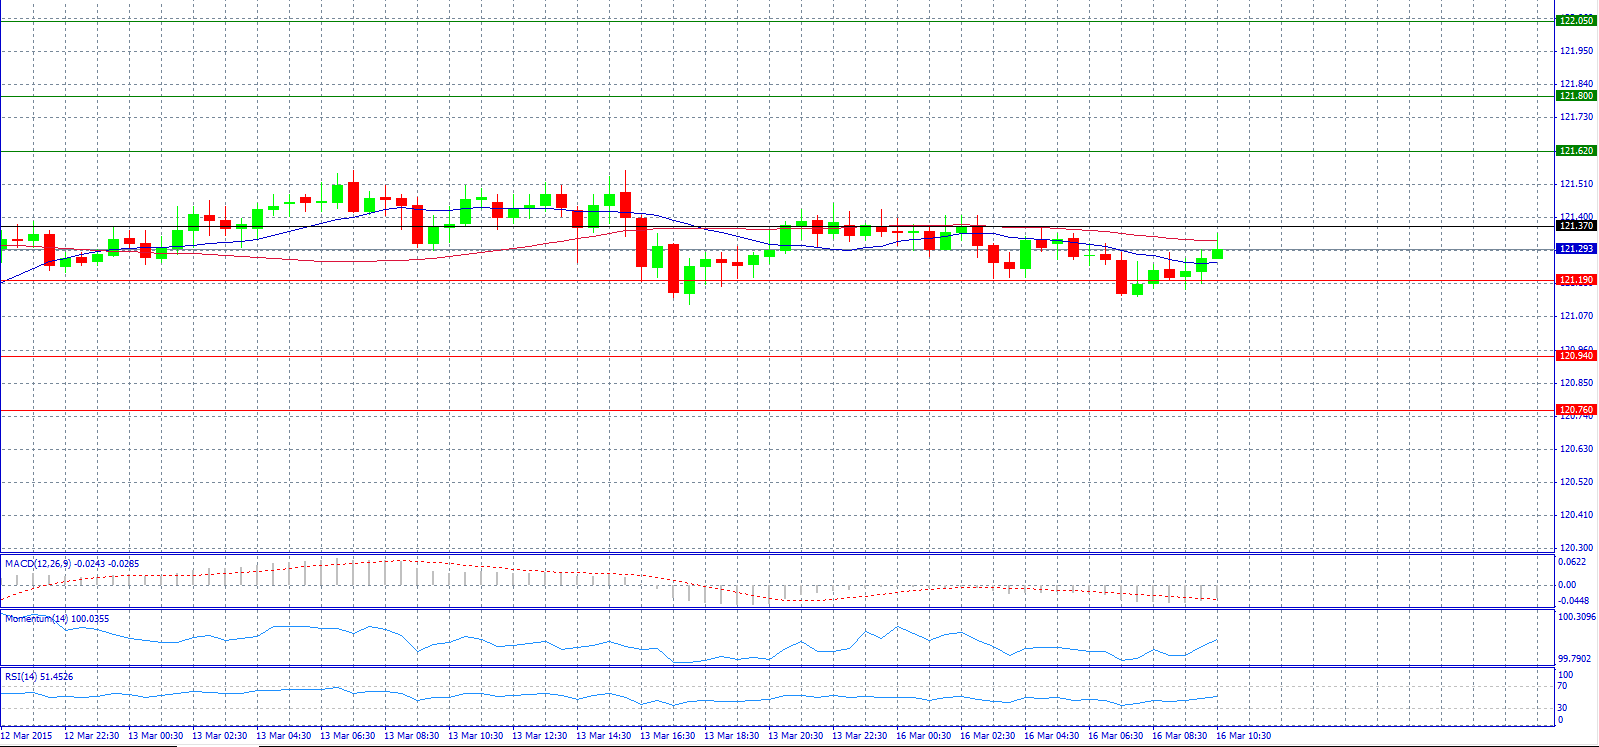
Market Scenario 1: Long positions above 121.37 with target @ 121.62.
Market Scenario 2: Short positions below 121.37 with target @ 120.94.
Comment: The pair found support at 121.19 level and now it’s advancing again.
Supports and Resistances:
R3 122.05
R2 121.80
R1 121.62
PP 121.37
S1 121.19
S2 120.94
S3 120.76
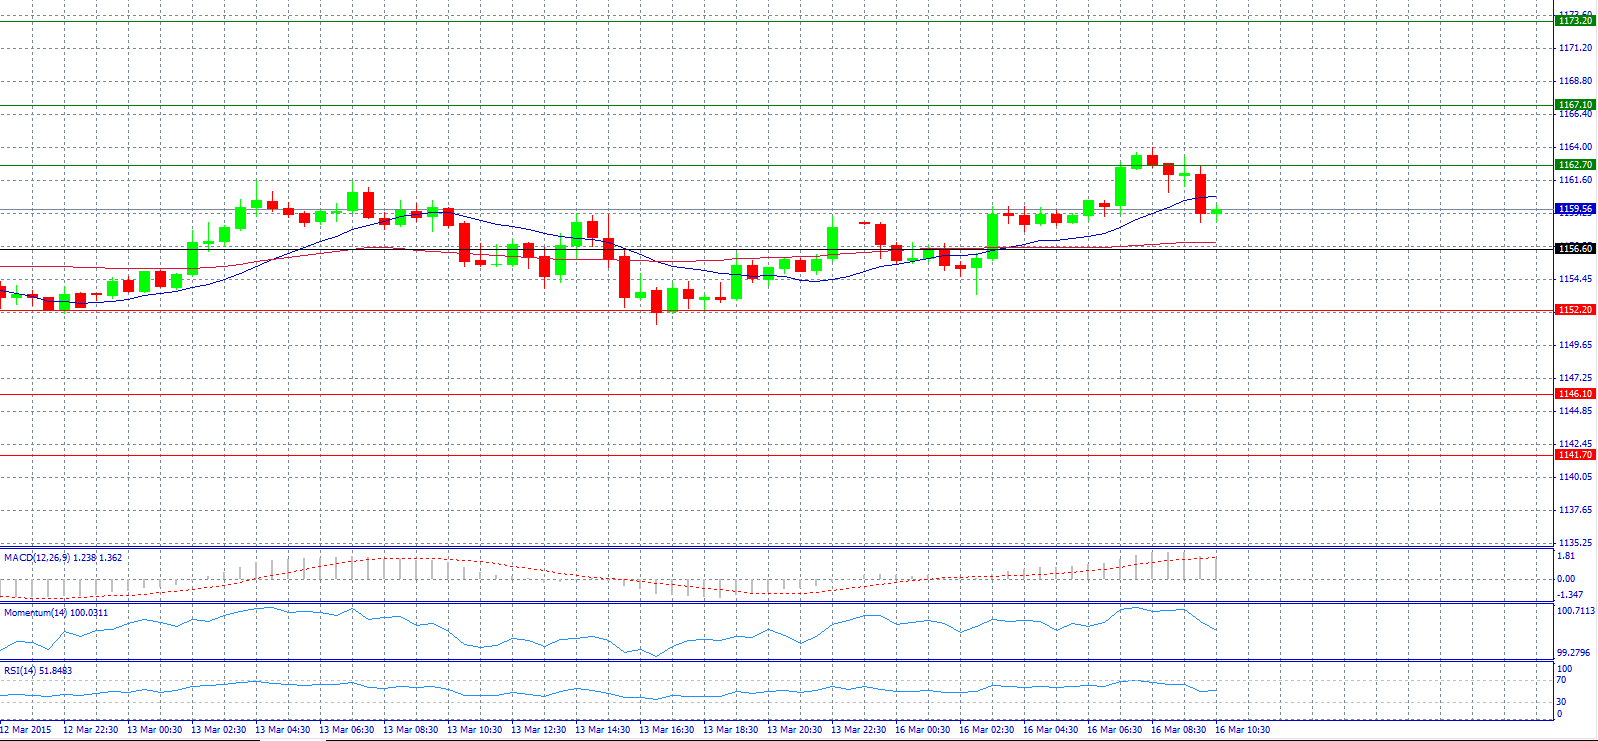
Market Scenario 1: Long positions above 1156.60 with target @ 1167.10.
Market Scenario 2: Short positions below 1156.60 with target @ 1152.20.
Comment: Gold prices are near lowest levels in over three months ahead of Fed meeting.
Supports and Resistances:
R3 1173.20
R2 1167.10
R1 1162.70
PP 1156.60
S1 1152.20
S2 1146.10
S3 1141.70
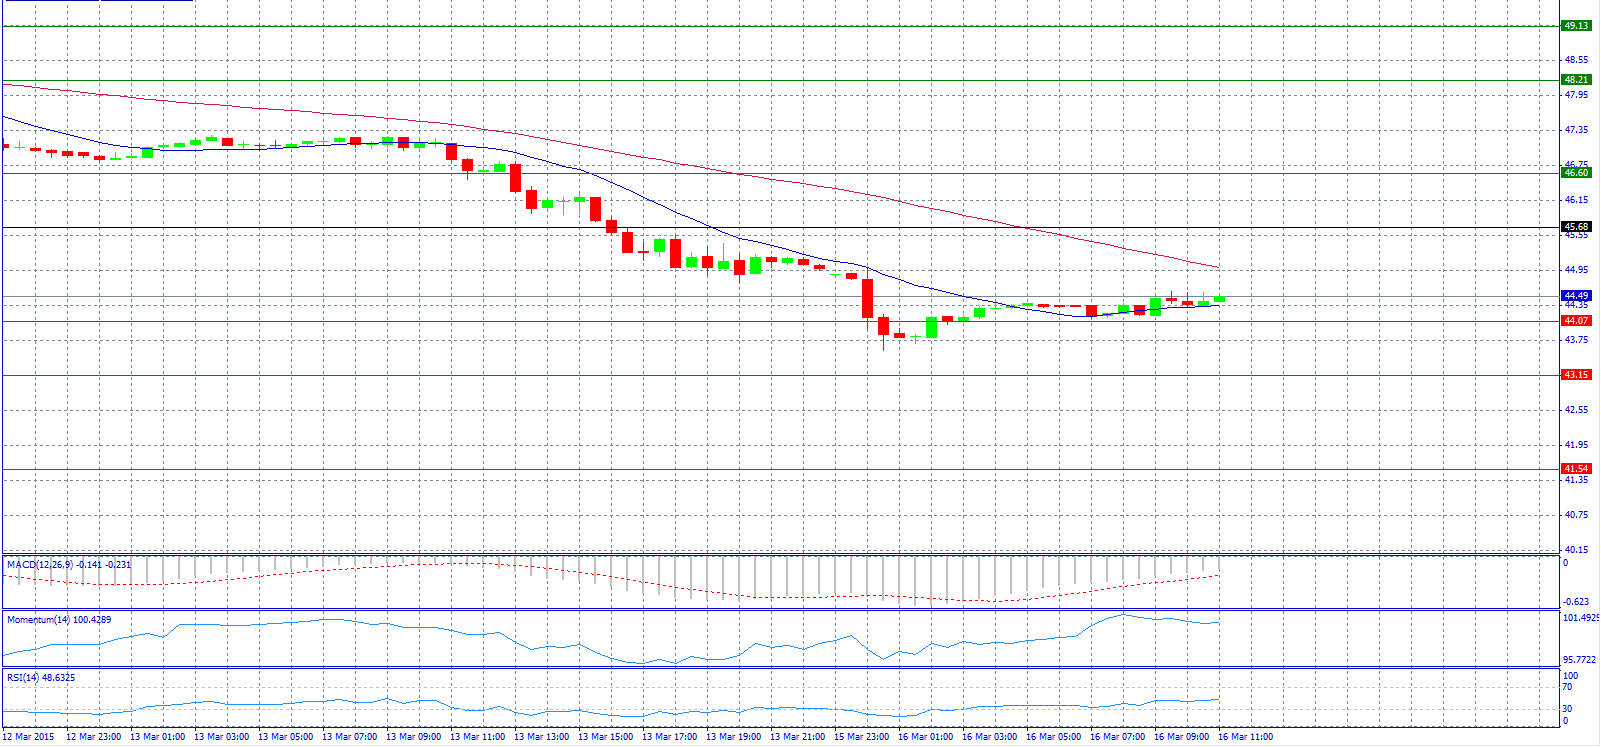
Market Scenario 1: Long positions above 45.68 with target @ 46.60.
Market Scenario 2: Short positions below 45.68 with target @ 44.07.
Comment: Crude oil prices fall by 2.1% on weak Asian cues.
Supports and Resistances:
R3 49.13
R2 48.21
R1 46.60
PP 45.68
S1 44.07
S2 43.15
S3 41.54
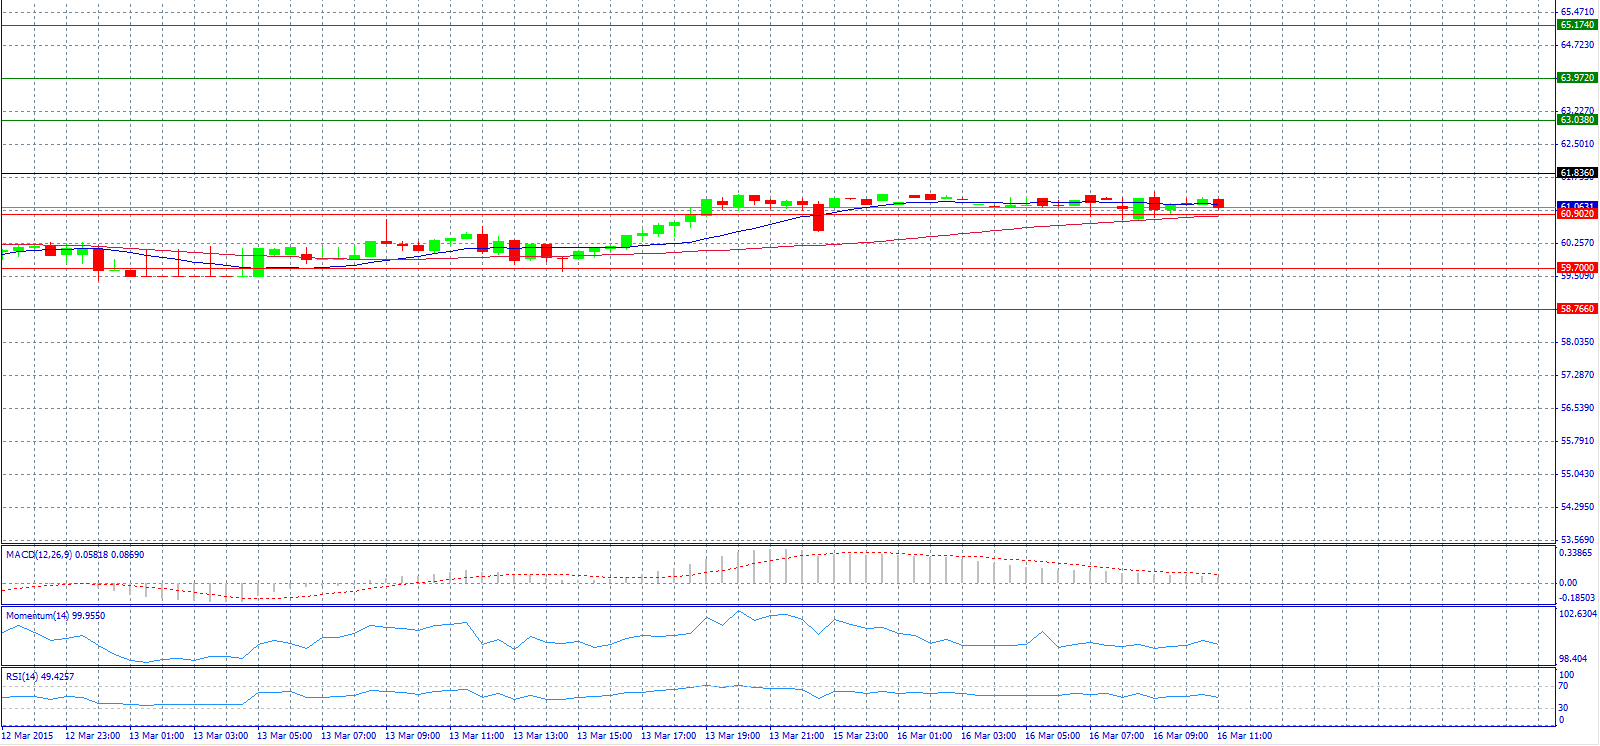
Market Scenario 1: Long positions above 61.836 with target @ 63.038.
Market Scenario 2: Short positions below 61.836 with target @ 59.700.
Comment: The confidence of the investors has returned for the ruble, and even a rate cut today left it unfazed.
Supports and Resistances:
R3 65.174
R2 63.972
R1 63.038
PP 61.836
S1 60.902
S2 59.700
S3 58.766
