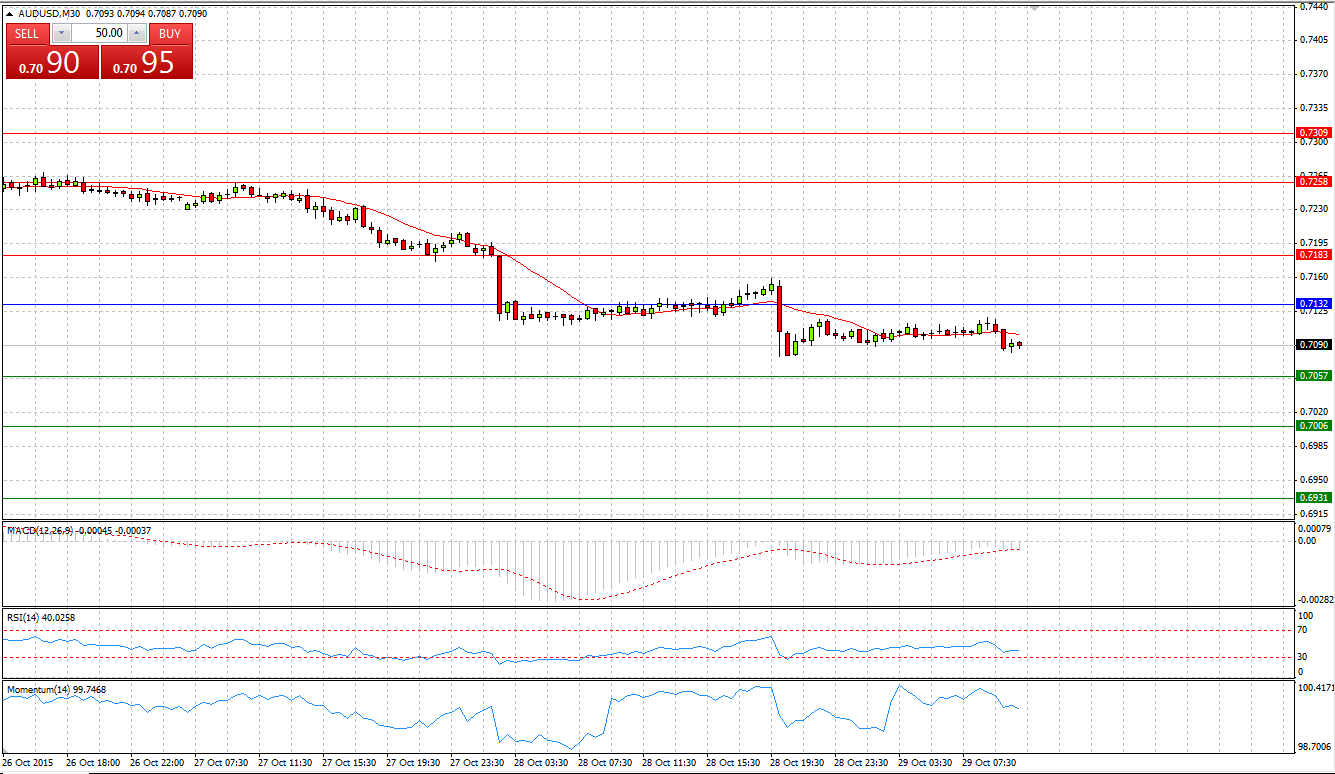
Market Scenario 1: Long positions above 0.7132 with targets at 0.7057 and 0.7006
Market Scenario 2: Short positions below 0.7132 with targets at 0.7183 and 0.7258
Comment: During yesterday’s session, AUD/USD came under selling pressure and broke through Support level at 0.7183, which supported the currency pair since 22nd of October. At the time being, the currency is trading close to the First Support level for today. Succeeded to break through it, AUD/USD may undertake attempts to test second and third Support levels
Supports and Resistances:
R3 0.7309
R2 0.7258
R1 0.7183
PP 0.7132
S1 0.7057
S2 0.7006
S3 0.6931
EUR/JPY
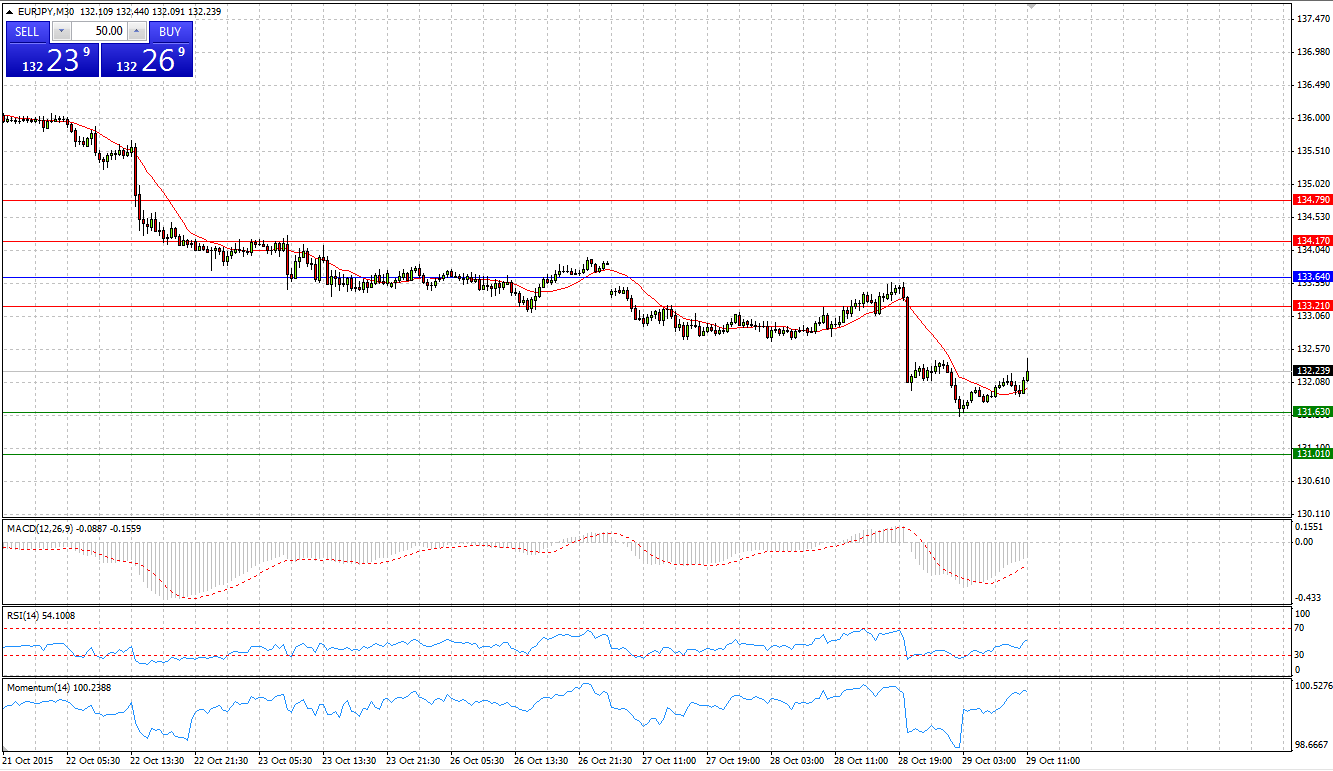
Market Scenario 1: Long positions above 133.64 with targets at 133.21 and 134.17
Market Scenario 2: Short positions below 133.64 with targets at 131.63 and 131.01
Comment: During yesterday’s session, European currency continued depreciating against Japanese yen, sinking below its lowest level reached on 4th of September at 132.31. Today, during Asian session, EUR/JPY recorded a new low at 131.574, which is slightly below the First Support level.
Supports and Resistances:
R3 134.79
R2 134.17
R1 133.21
PP 133.64
S1 131.63
S2 131.01
S3 130.05
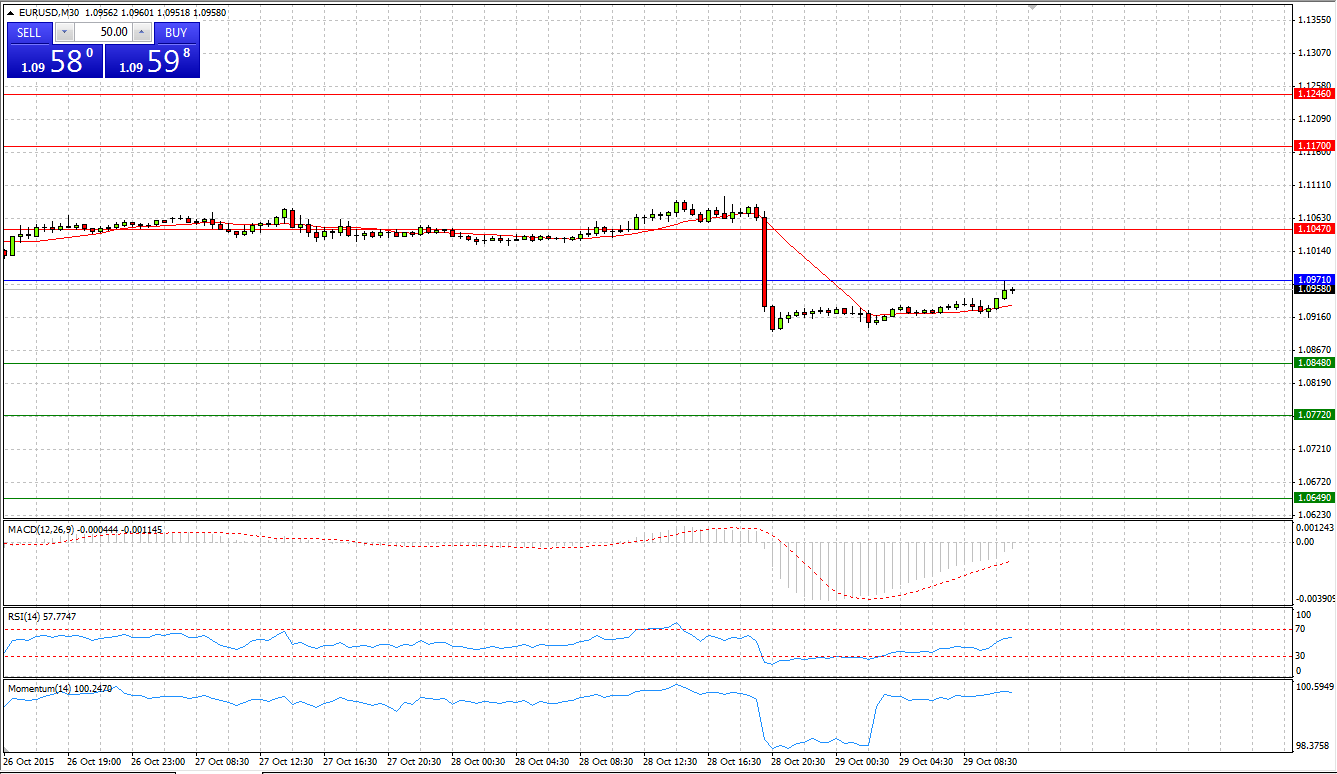
Market Scenario 1: Long positions above 1.0971 with targets at 1.1047 and 1.1170
Market Scenario 2: Short positions below 1.0971 with targets at 1.0848 and 1.0772
Comment: European currency was sold-off during yesterday’s session against US dollar, depreciating for more than 100 pips pre one day. Currently, the pair is trading slightly below Pivot Pint level, which stands close to psychologically important level of 1.10 US dollar per 1 euro.
Supports and Resistances:
R3 1.1246
R2 1.1170
R1 1.1047
PP 1.0971
S1 1.0848
S2 1.0772
S3 1.0649
GBP/JPY
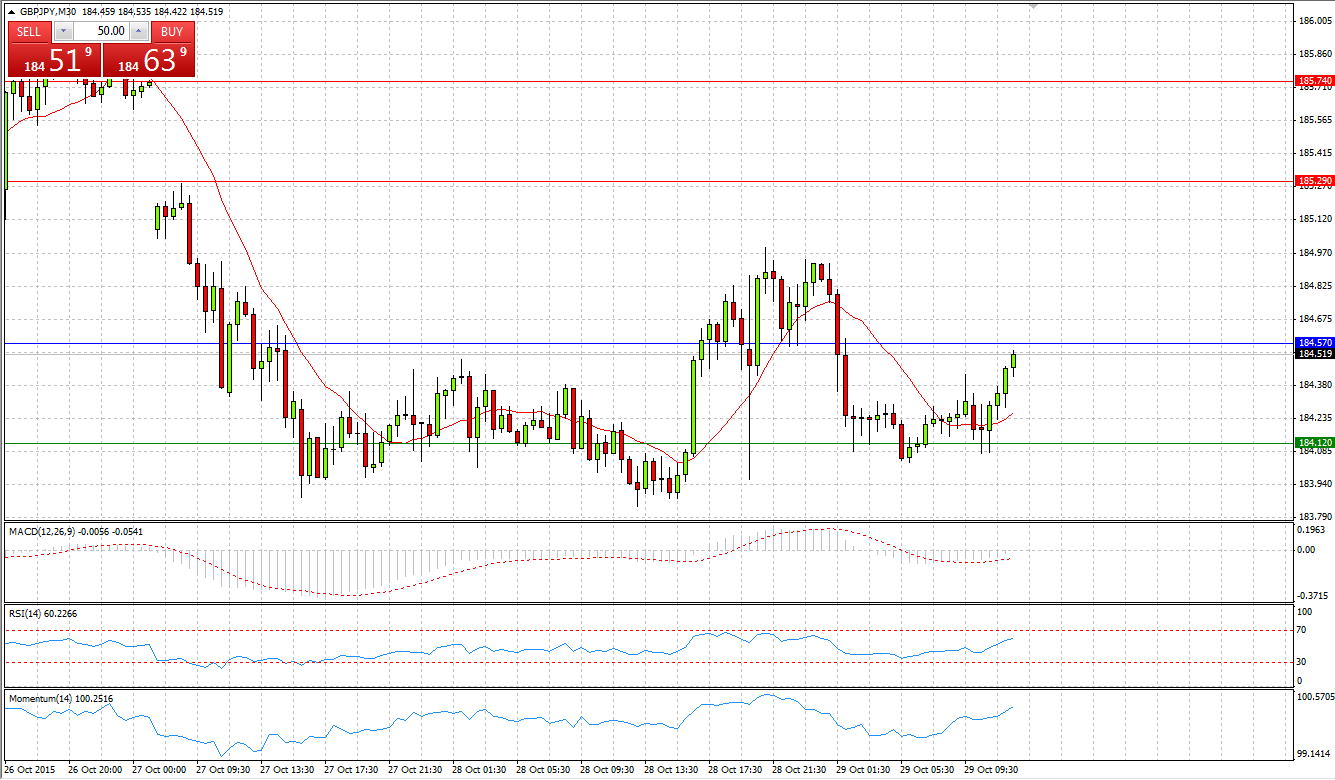
Market Scenario 1: Long positions above 184.57 with targets at 185.29 and 185.74
Market Scenario 2: Short positions below 184.57 with targets at 184.12 and 183.40
Comment: GBP/JPY continues trading slightly above the First Support level, which is close to highs reached on 9-12th of October. Currency remains under selling pressure, however, if bears won’t succeed in breaking through S1, bulls might take the control back.
Supports and Resistances:
R3 186.46
R2 185.74
R1 185.29
PP 184.57
S1 184.12
S2 183.40
S3 182.95
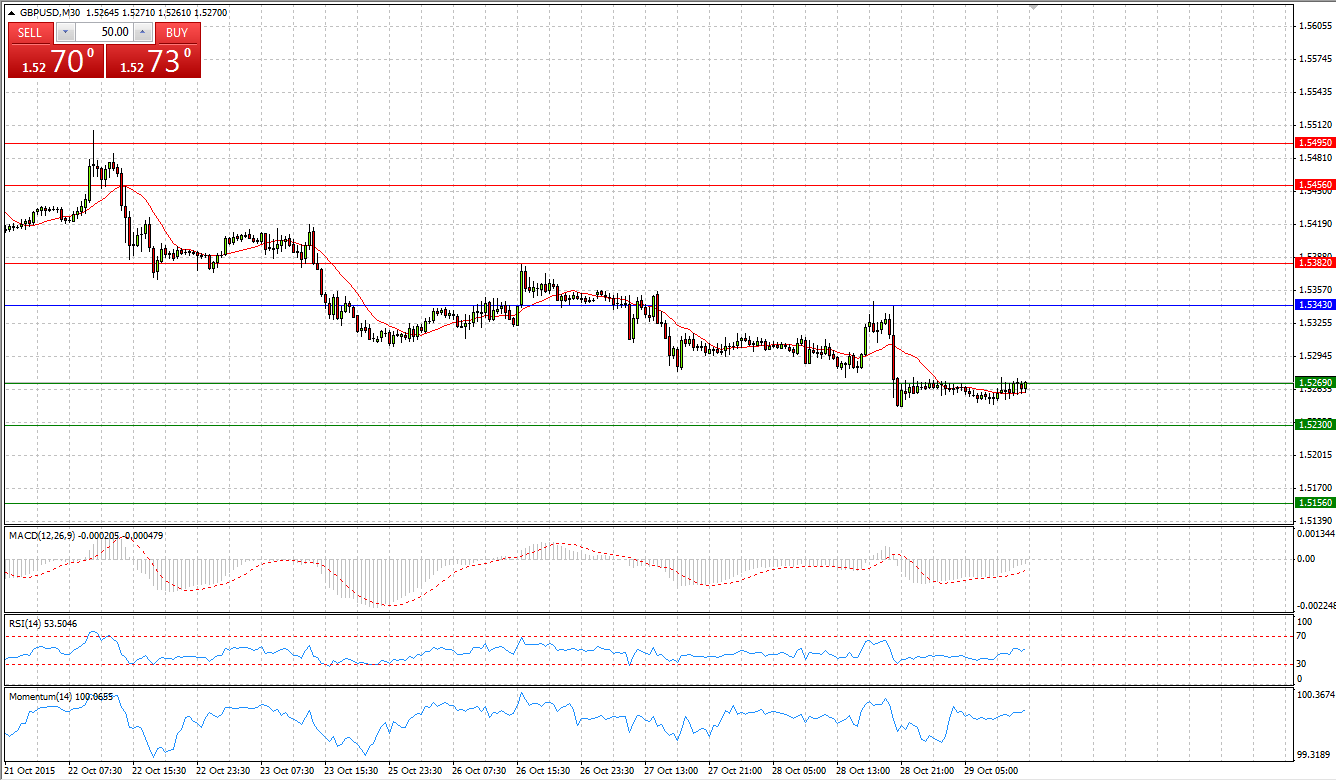
Market Scenario 1: Long positions above 1.5286 with targets at 1.5324 and 1.5384
Market Scenario 2: Short positions below 1.5286 with targets at 1.5226 and 1.5188
Comment: Sterling continues depreciating against US dollar, reaching its lowest level since 14th of October at 1.5247 during yesterday’s session. Today we have US Advanced GDP and Unemployment claims, positive reading might give additional stimulus for Bears to push the pair lower.
Supports and Resistances:
R3 1.5422
R2 1.5384
R1 1.5324
PP 1.5286
S1 1.5226
S2 1.5188
S3 1.5128
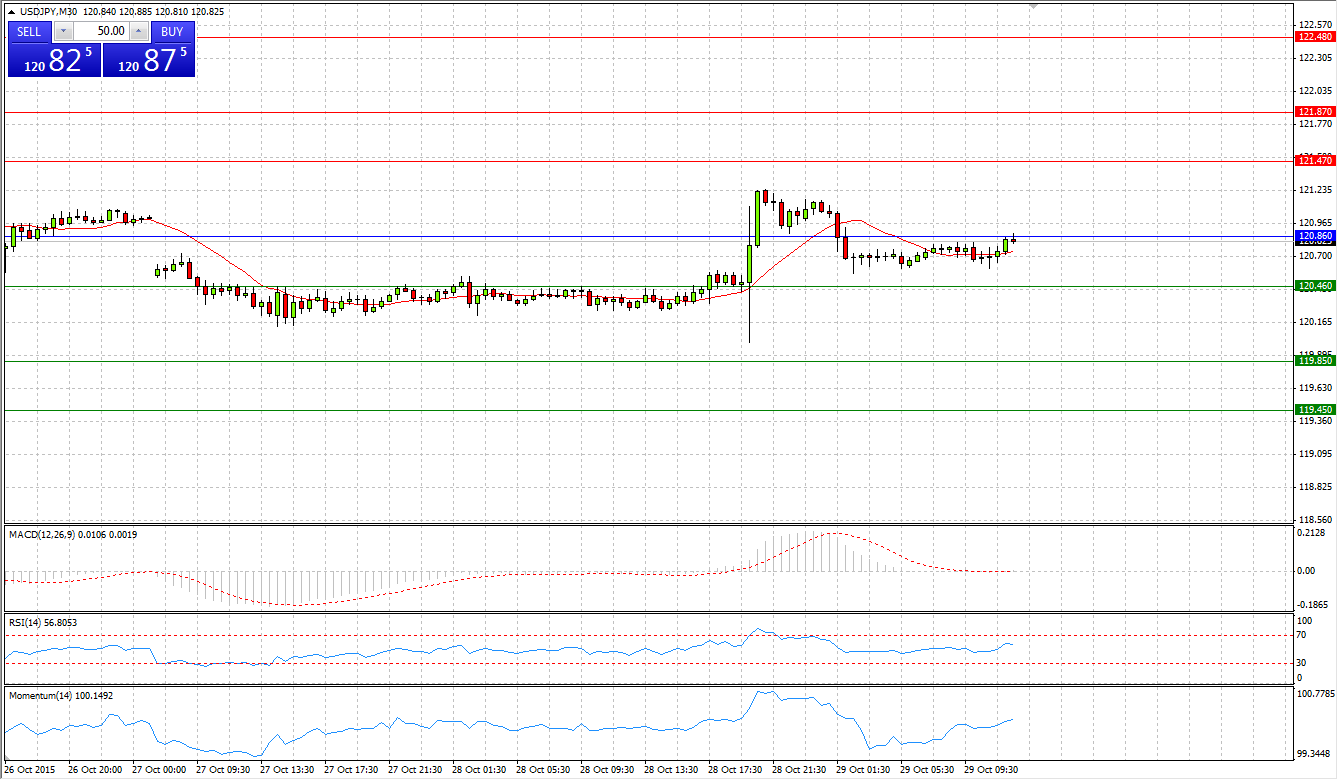
Market Scenario 1: Long positions above 120.86 with targets at 121.47 and 121.87
Market Scenario 2: Short positions below 120.86 with targets at 120.46 and 119.85
Comment: US dollar during yesterday’s session managed to regain all of his losses incurred on Wednesday against Japanese yen. However, in the bigger picture, the pair remains trading in the range between S3 and R2
Supports and Resistances:
R3 122.48
R2 121.87
R1 121.47
PP 120.86
S1 120.46
S2 119.85
S3 119.45
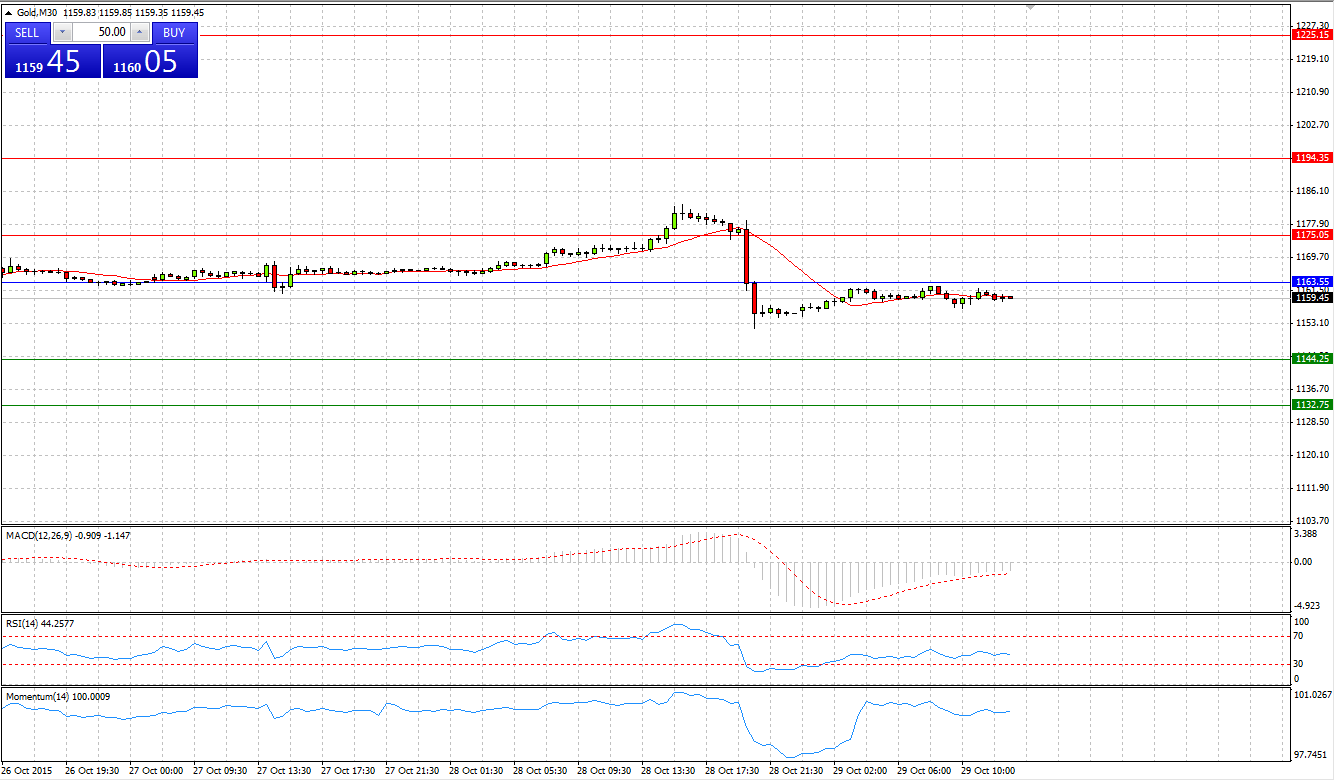
Market Scenario 1: Long positions above 1163.55 with targets at 1175.05 and 1194.35
Market Scenario 2: Short positions below 1163.55 with targets at 1144.25 and 1132.75
Comment: Bullion during yesterday’s session was very volatile, having raised almost to its recent highs. Gold came under selling pressure and dropped below its recent lows of 1158.65, closing the day 1155.75. During today’s session, gold has been trading flat, slightly below Pivot Point Level
Supports and Resistances:
R3 1225.15
R2 1194.35
R1 1175.05
PP 1163.55
S1 1144.25
S2 1132.75
S3 1101.95
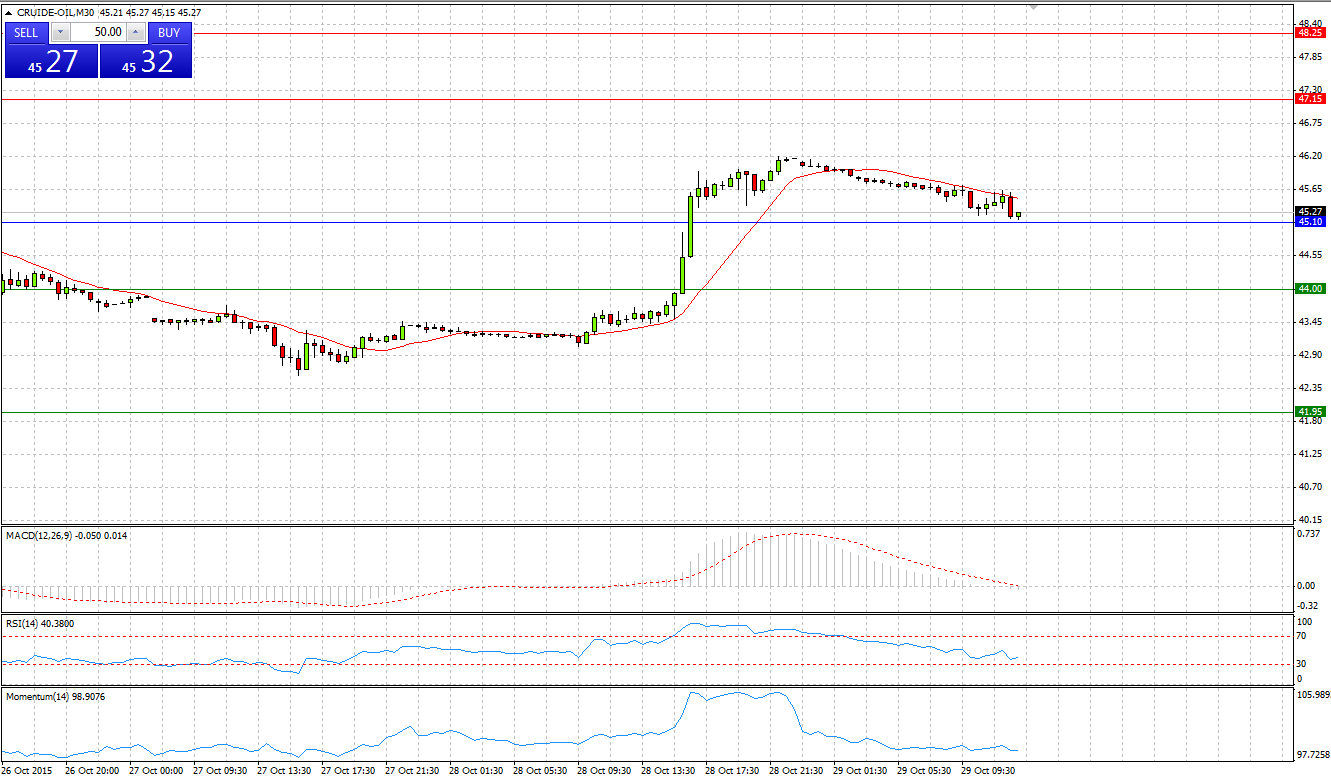
CRUDE OIL
Market Scenario 1: Long positions above 45.10 with targets at 47.15 and 48.25
Market Scenario 2: Short positions below 45.10 with targets at 44.00 and 41.95
Comment: Having reached its lowest level on Wednesday at 42.57, bulls managed to regain the control and pushed crude prices as high as 46.20 during yesterday’s session. At the time being, crude is trading slightly above Pivot Point level.
Supports and Resistances:
R3 51.40
R2 48.25
R1 47.15
PP 45.10
S1 44.00
S2 41.95
S3 38.80
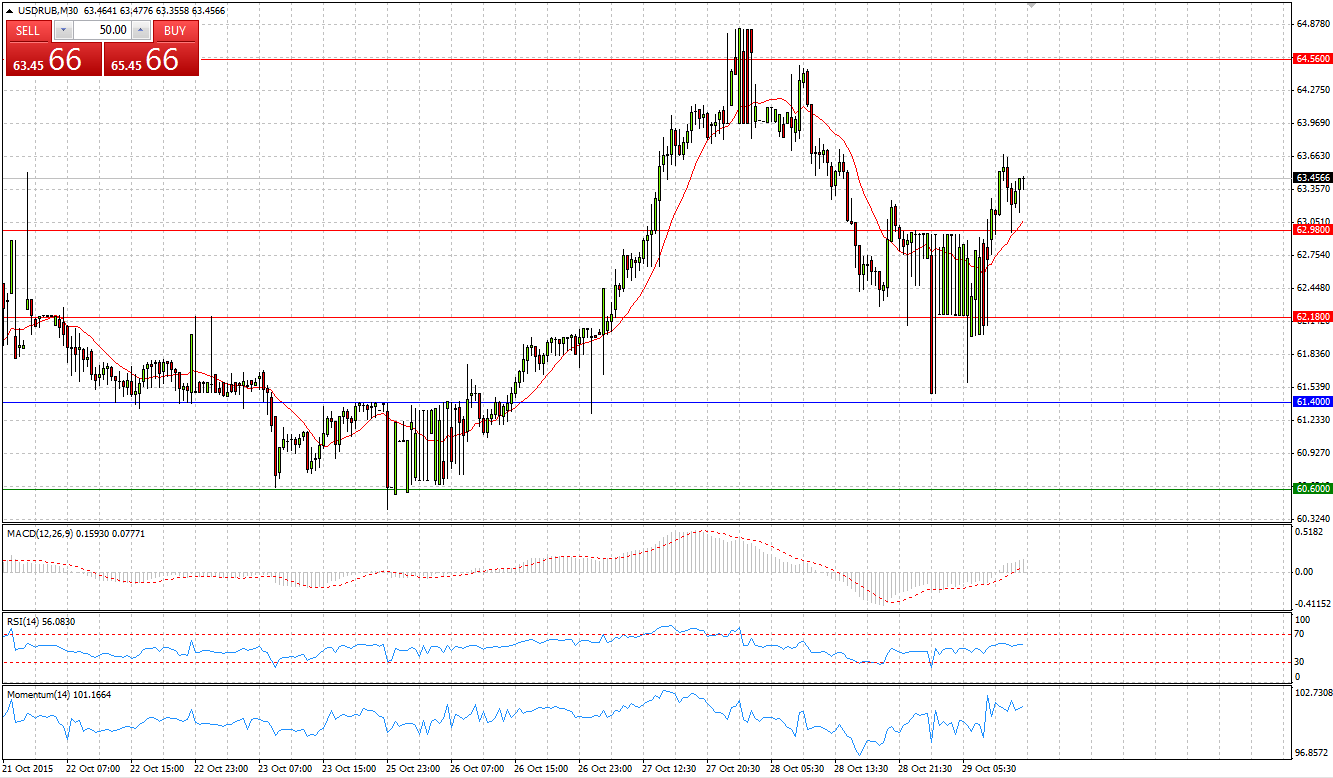
USD/RUB
Market Scenario 1: Long positions above 61.57 with targets at 62.59 and 63.09
Market Scenario 2: Short positions below 61.57 with targets at 61.06 and 60.04
Comment: USD/RUB amid increased prices of crude oil dropped from its highest level since 6th of October of 64.8453 to close the day 62.94. Further appreciation of crude prices will push the pair lower.
Supports and Resistances:
R3 64.62
R2 63.09
R1 62.59
PP 61.57
S1 61.06
S2 60.04
S3 58.51
