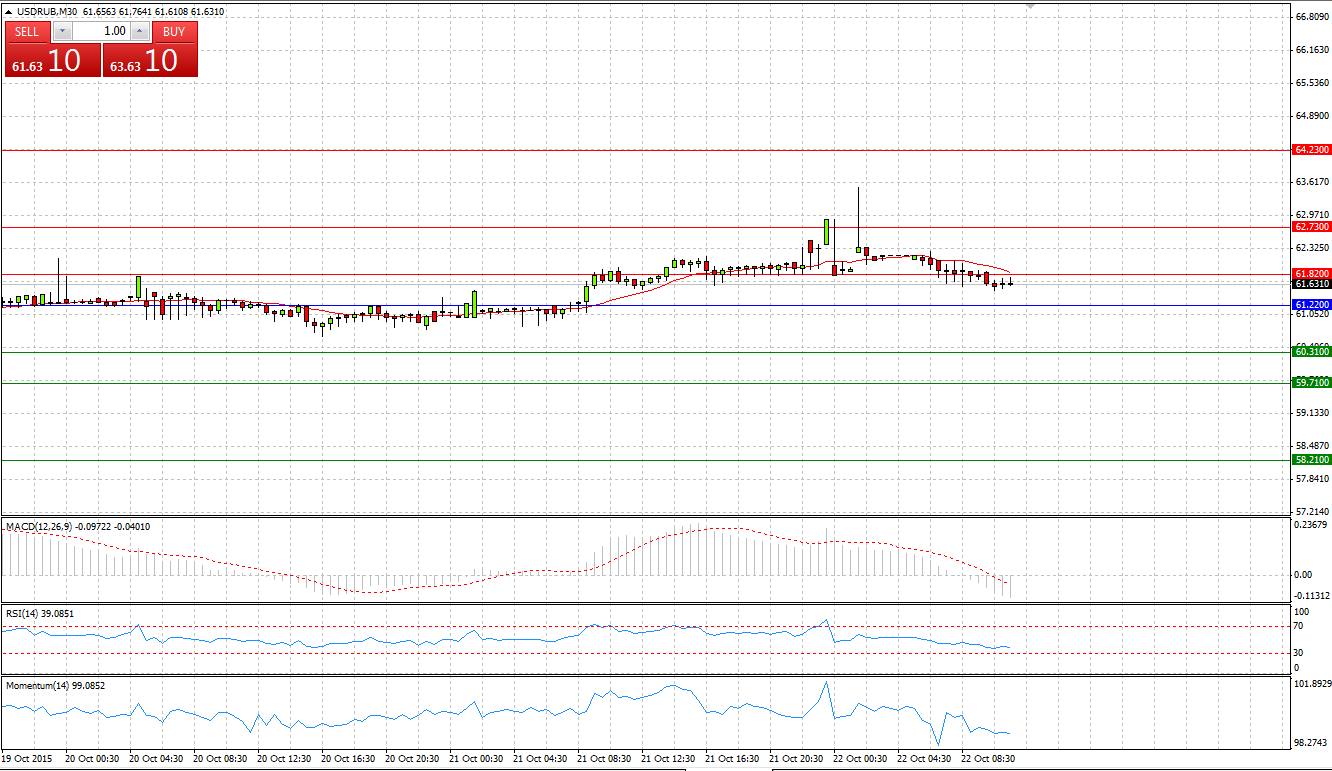
Market Scenario 1: Long positions above 0.7236 with targets at 0.7274 & 0.7335
Market Scenario 2: Short positions below 0.7236 with targets at 0.7175 & 0.7137
Comment: Being unable to break the First Resistance level during Friday’s session, AUD/USD ended the day adjacent to its opening price not far from to the First Support level. During early Asian session, the pair undertook another attempt to test R1 and already broke through Pivot Point level.
Supports and Resistances:
R3 0.7373
R2 0.7335
R1 0.7274
PP 0.7236
S1 0.7175
S2 0.7137
S3 0.7076
EUR/JPY
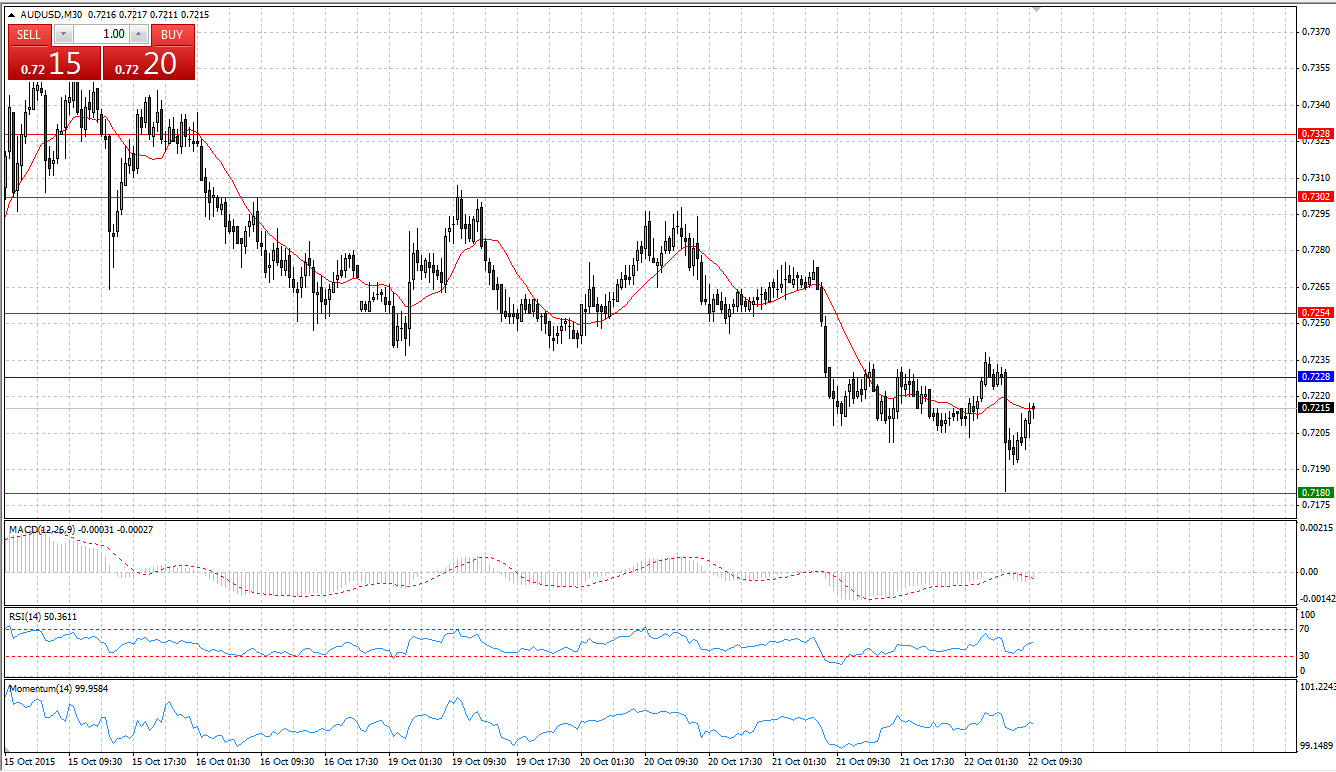
Market Scenario 1: Long positions above 133.79 with targets at 134.22 & 134.69
Market Scenario 2: Short positions below 133.79 with targets at 133.32 & 132.89
Comment: EUR/JPY has been drastically sold-off after European Central Bank President Mario Draghi‘s statement on Thursday. Draghi announced that policy makers discussed cutting the region’s deposit rate and a high possibility that ECB will re-examine its quantitative-easing plan in December. Amid the news, European currency lost more than 200 pips in 2 days. Currently, the pair is trading below Pivot Point level.
Supports and Resistances:
R3 135.12
R2 134.69
R1 134.22
PP 133.79
S1 133.32
S2 132.89
S3 132.42
EUR/USD
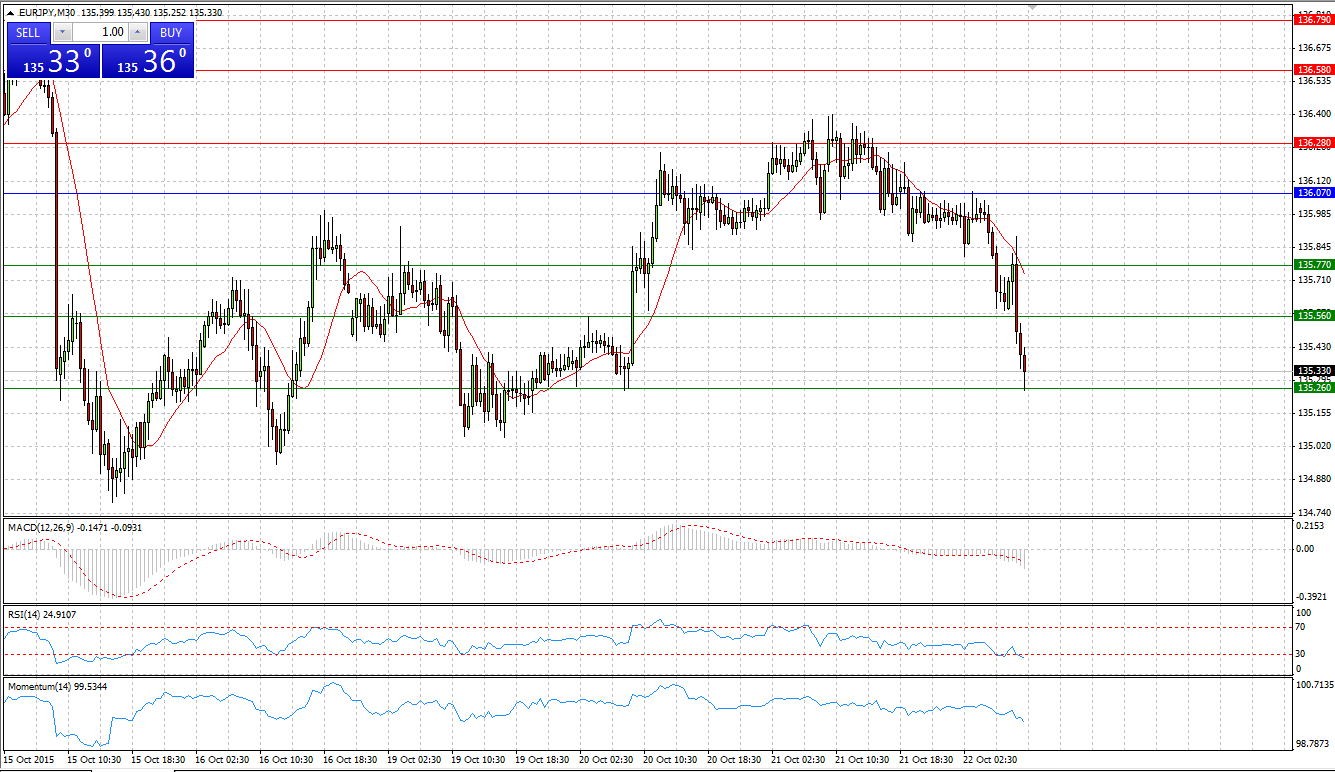
Market Scenario 1: Long positions above 1.1049 with targets at 1.1102 & 1.1192
Market Scenario 2: Short positions below 1.1049 with targets at 1.0959 & 1.0906
Comment: After the ECB President’s press conference, European currency depreciated for more than 250 pips against US dollar since Thursday. Mario Draghi shed some light on recent dictions of policy makers regarding the cuts of the region’s deposit rates and possible re-examination of quantitative-easing plan in December. Amid this news EUR/USD sunk to its lowest level at 1.0995 since 11th of August.
Supports and Resistances:
R3 1.1245
R2 1.1192
R1 1.1102
PP 1.1049
S1 1.0959
S2 1.0906
S3 1.0816
GBP/JPY
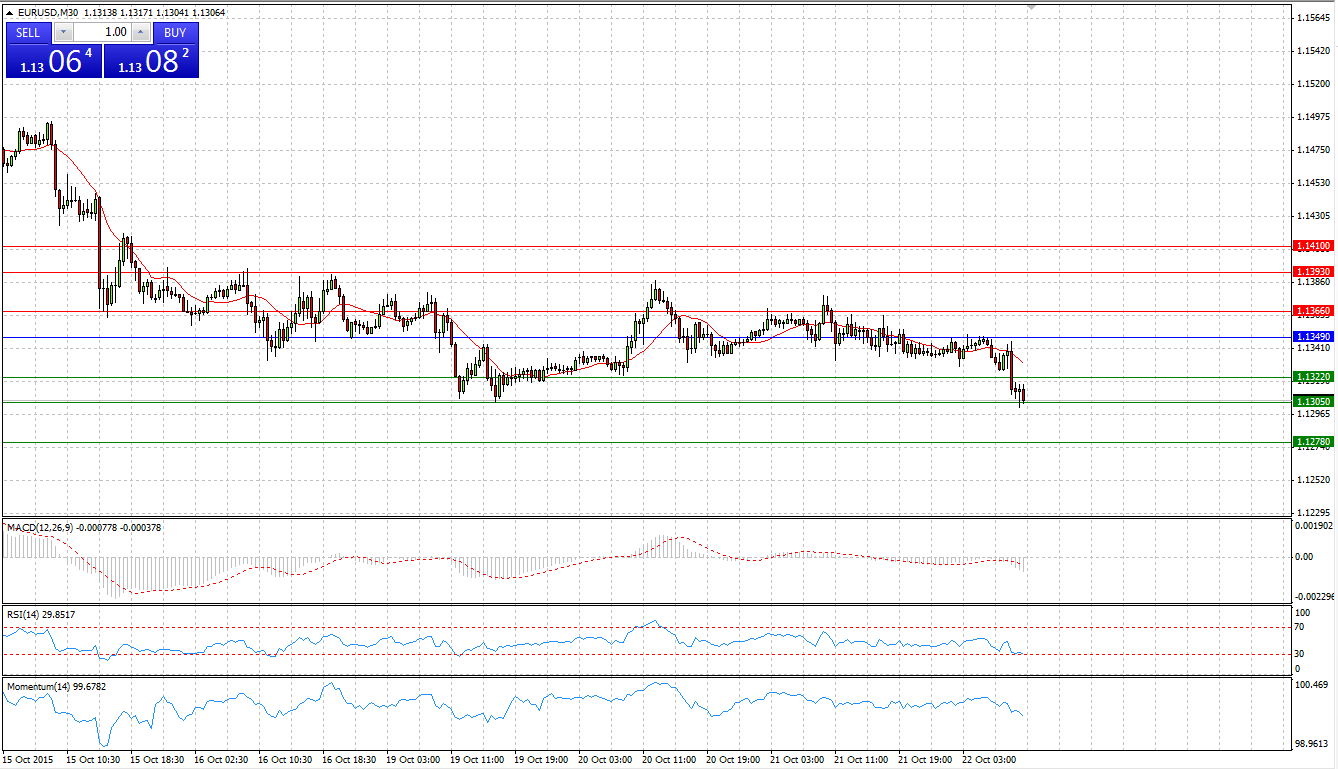
Market Scenario 1: Long positions above 185.82 with targets at 186.40 & 186.87
Market Scenario 2: Short positions below 185.82 with targets at 185.35 & 185.35
Comment: During Friday’s session Sterling reached a new high against Japanese Yen at 186 .26. However, having encountered selling pressure, GBP/JPY retreated below 186. During early Asian session on Monday, GBP/JPY continued sinking lower to reach its lowest level on Friday 23rd of October.
Supports and Resistances:
R3 187.45
R2 186.87
R1 186.40
PP 185.82
S1 185.35
S2 184.77
S3 184.30
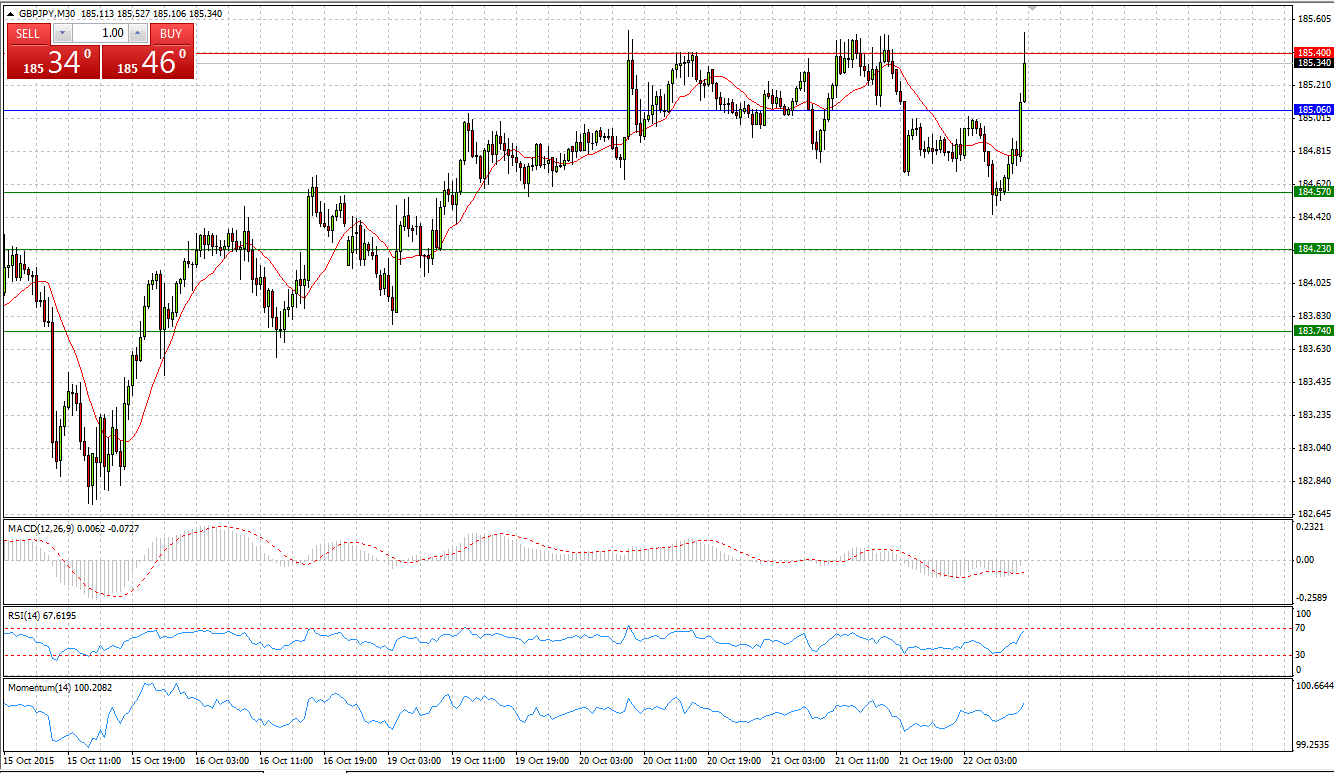
Market Scenario 1: Long positions above 1.5343 with targets at 1.5382 & 1.5456
Market Scenario 2: Short positions below 1.5343 with targets at 1.5269 & 1.5230
Comment: Having failed after number of attempts to break through the Strong Resistance level at $1.55 the Sterling dropped and in two days losing almost 200 pips against US Dollar. Currently the pair trading below Pivot Point Level which acts as a Resistance level.
Supports and Resistances:
R3 1.5495
R2 1.5456
R1 1.5382
PP 1.5343
S1 1.5269
S2 1.5230
S3 1.5156
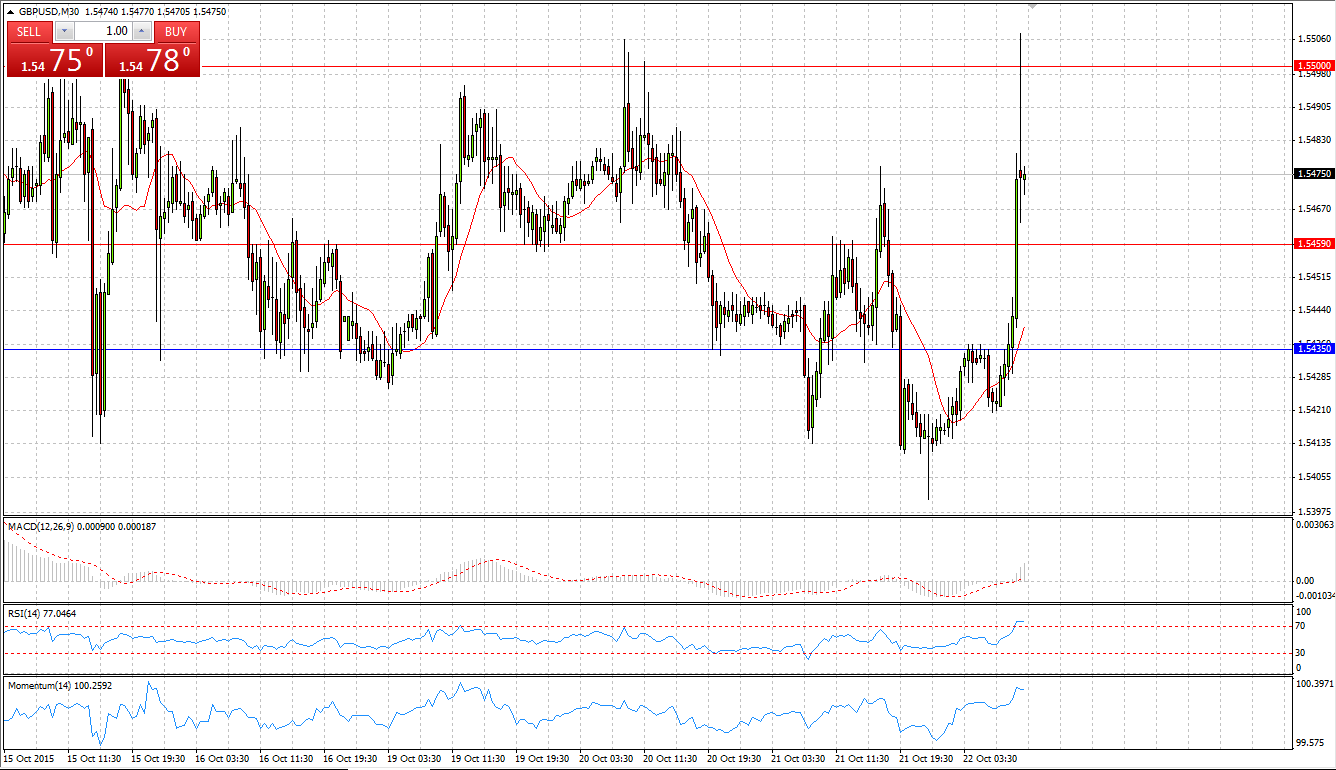
Market Scenario 1: Long positions above 121.05 with targets at 121.75 & 122.30
Market Scenario 2: Short positions below 121.05 with targets at 120.62 & 119.80
Comment: US Dollar during Friday’s session broke through the ceiling of the consolidation area at ¥121.3 which managed to withhold the pair since 9th of August. The pair closed the day near to its highs at 121.4. However, in order to treat this breakout as end of consolidation period a confirmation is a must. The price should end the day above 121.75 Japanese Yen per US Dollar.
Supports and Resistances:
R3 123.12
R2 122.30
R1 121.75
PP 121.05
S1 120.62
S2 119.80
S3 119.42
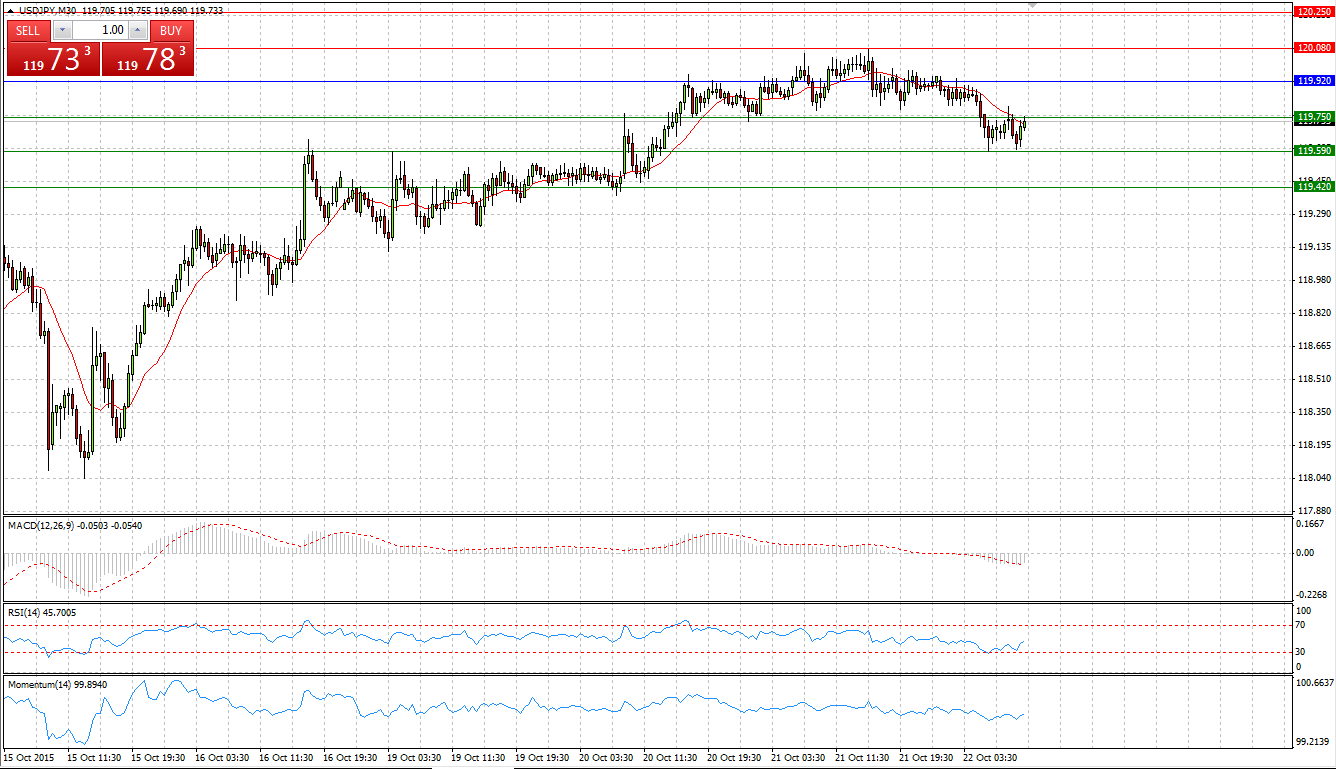
Market Scenario 1: Long positions above 1167.39 with targets at 1176.12 & 1188.03
Market Scenario 2: Short positions below 1167.39 with targets at 1155.48 & 1146.75
Comment: After a number of attempts to break through the First Resistance level at 1176.12, Gold was sold-off during Friday’s session and closed the day in a negative territory. For the time being, Gold is trading flat slightly below Pivot Point level.
Supports and Resistances:
R3 1208.67
R2 1188.03
R1 1176.12
PP 1167.39
S1 1155.48
S2 1146.75
S3 1126.11
Market Scenario 1: Long positions above 44.84 with targets at 45.50 & 46.38
Market Scenario 2: Short positions below 44.84 with targets at 43.96 & 43.30
Comment: Crude continues trading in the range between 45 – 44.50 US dollar a barrel. With almost empty economic calendar today, Crude is expected to remain trading in the range.
Supports and Resistances:
R3 47.92
R2 46.38
R1 45.50
PP 44.84
S1 43.96
S2 43.30
S3 41.76
USD/RUB
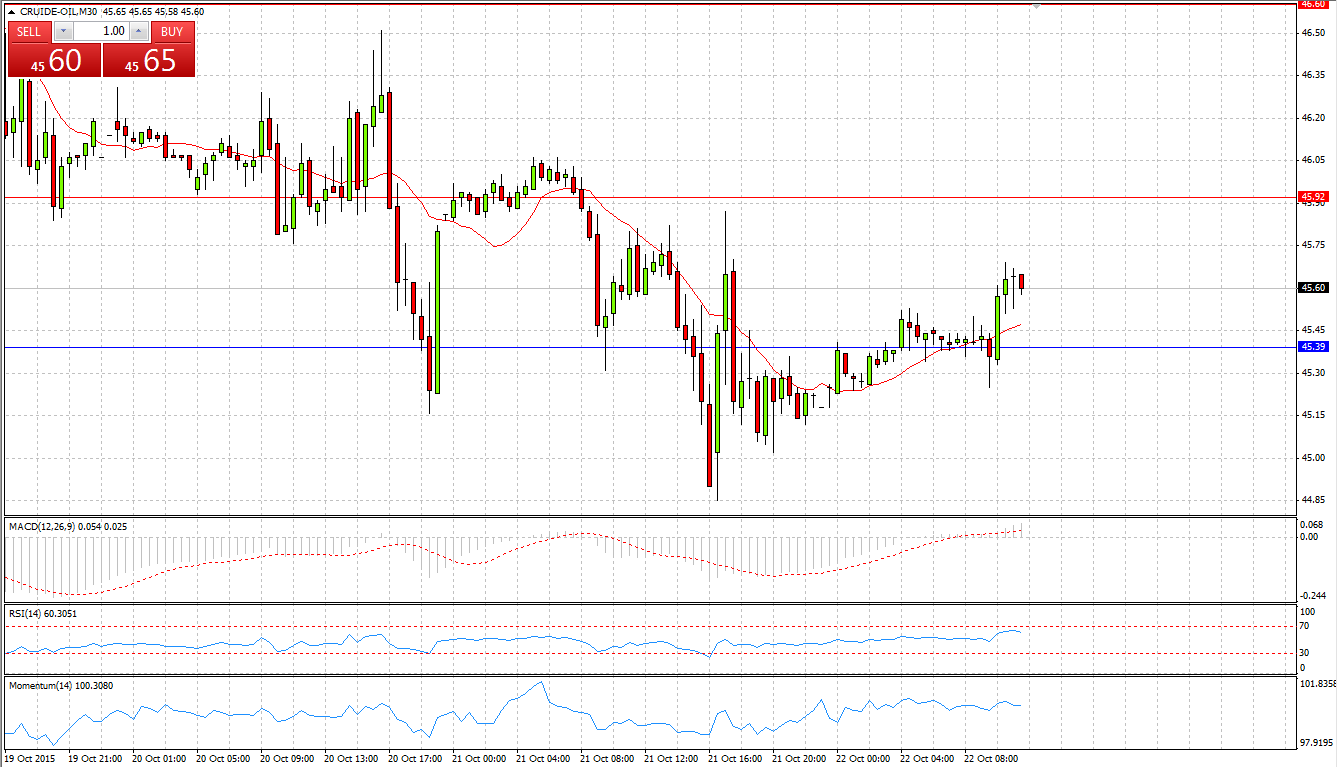
Market Scenario 1: Long positions above 61.40 with targets at 62.18 & 62.98
Market Scenario 2: Short positions below 61.40 with targets at 60.60 & 59.82
Comment: USD/RUB continue trading in a range. Currently, USD/RUB is trading below Pivot Point Level.
Supports and Resistances:
R3 64.56
R2 62.98
R1 62.18
PP 61.40
S1 60.60
S2 59.82
S3 58.23
