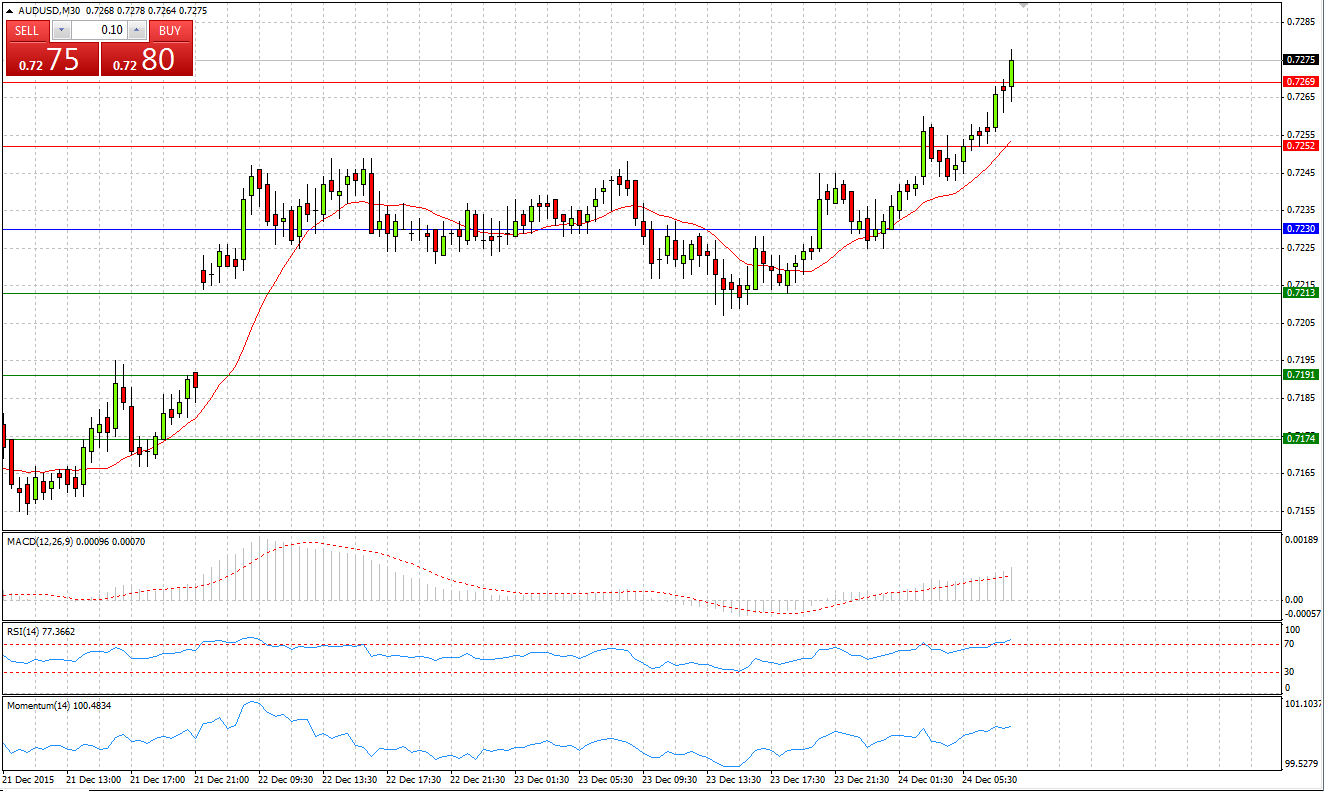
Market Scenario 1: Long positions above 0.7230 with targets at 0.7252 and 0.7269
Market Scenario 2: Short positions below 0.7230 with targets at 0.7213 and 0.7191
Comment: Aussie having broken through the Pivot Point level during early Asian session found additional support and started rapidly strengthening against the US dollar, having already broke through first and second Resistance levels. AUD/USD is currently aiming to test the last resistance level for today.
Supports and Resistances:
R3 0.7291
R2 0.7269
R1 0.7252
PP 0.7230
S1 0.7213
S2 0.7191
S3 0.7174
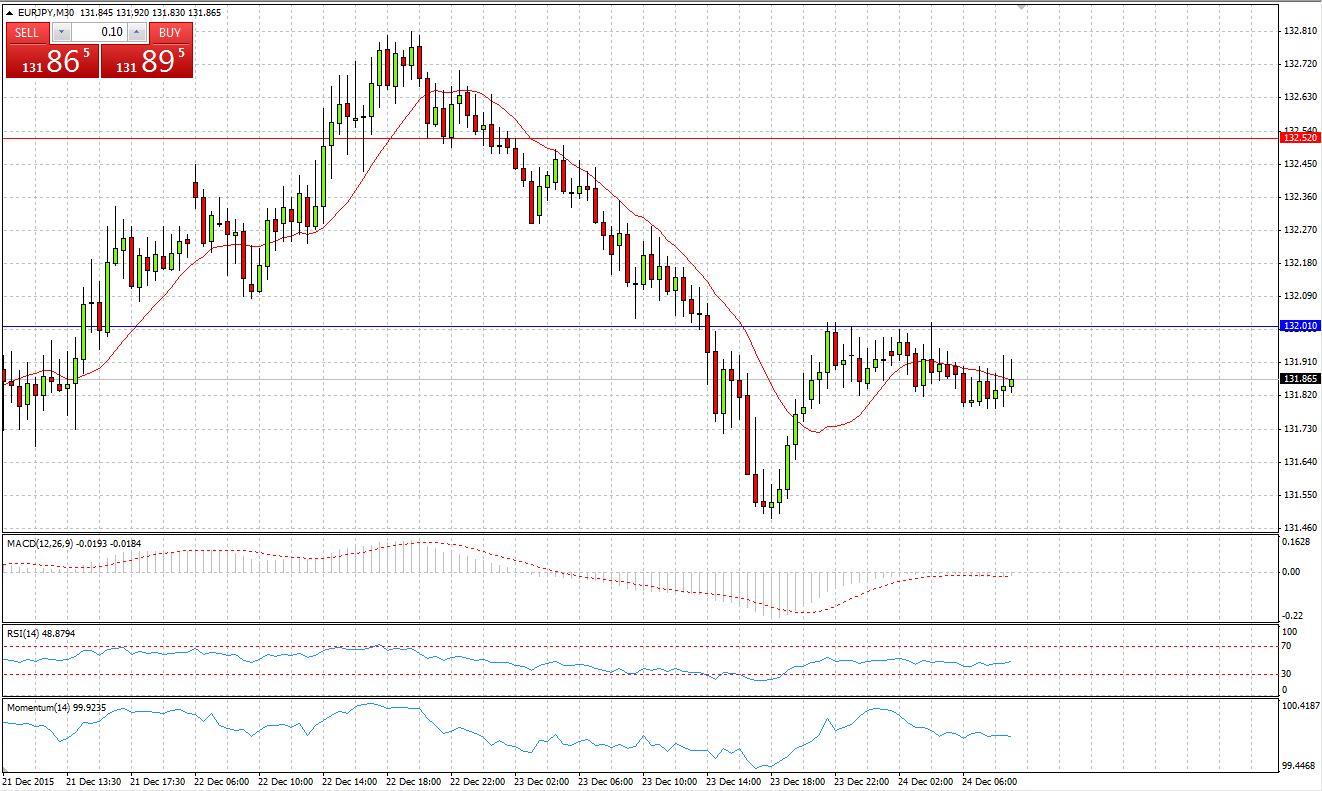
Market Scenario 1: Long positions above 132.01 with targets at 132.52 and 133.14
Market Scenario 2: Short positions below 132.01 with targets at 131.39 and 130.88
Comment: European currency came under selling pressure during yesterday’s session and lost more than 65 pips in one day. Today the pair is trading flat amid empty economic calendar and public holidays in most of the countries.
Supports and Resistances:
R3 133.65
R2 133.14
R1 132.52
PP 132.01
S1 131.39
S2 130.88
S3 130.26
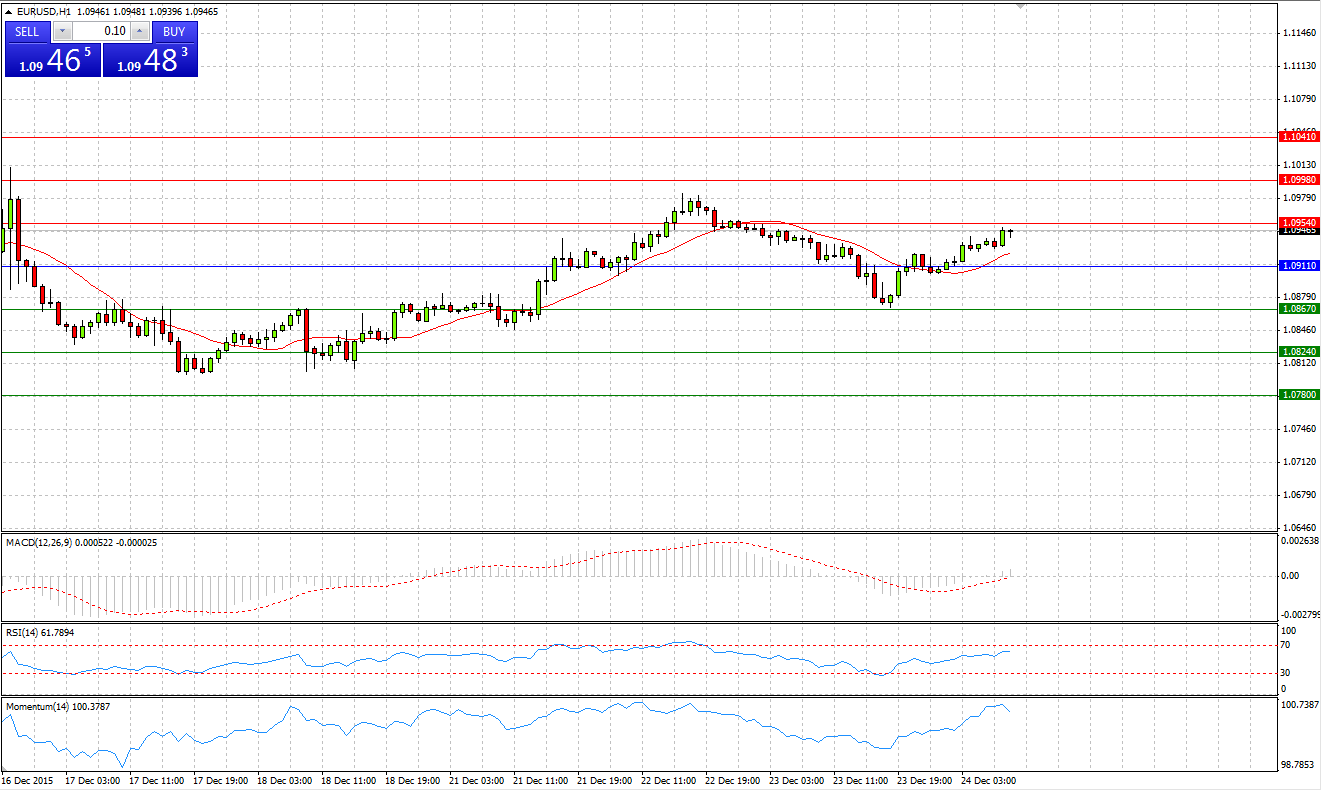
Market Scenario 1: Long positions above 1.0911 with targets at 1.0954 and 1.0998
Market Scenario 2: Short positions below 1.0911 with targets at 1.0867 and 1.0824
Comment: European currency weakened against US dollar during yesterday’s session, however today the pair managed to regain all of its losses incurred yesterday. Currently the pair is trading close to the First Resistance level.
Supports and Resistances:
R3 1.1041
R2 1.0998
R1 1.0954
PP 1.0911
S1 1.0867
S2 1.0824
S3 1.0780
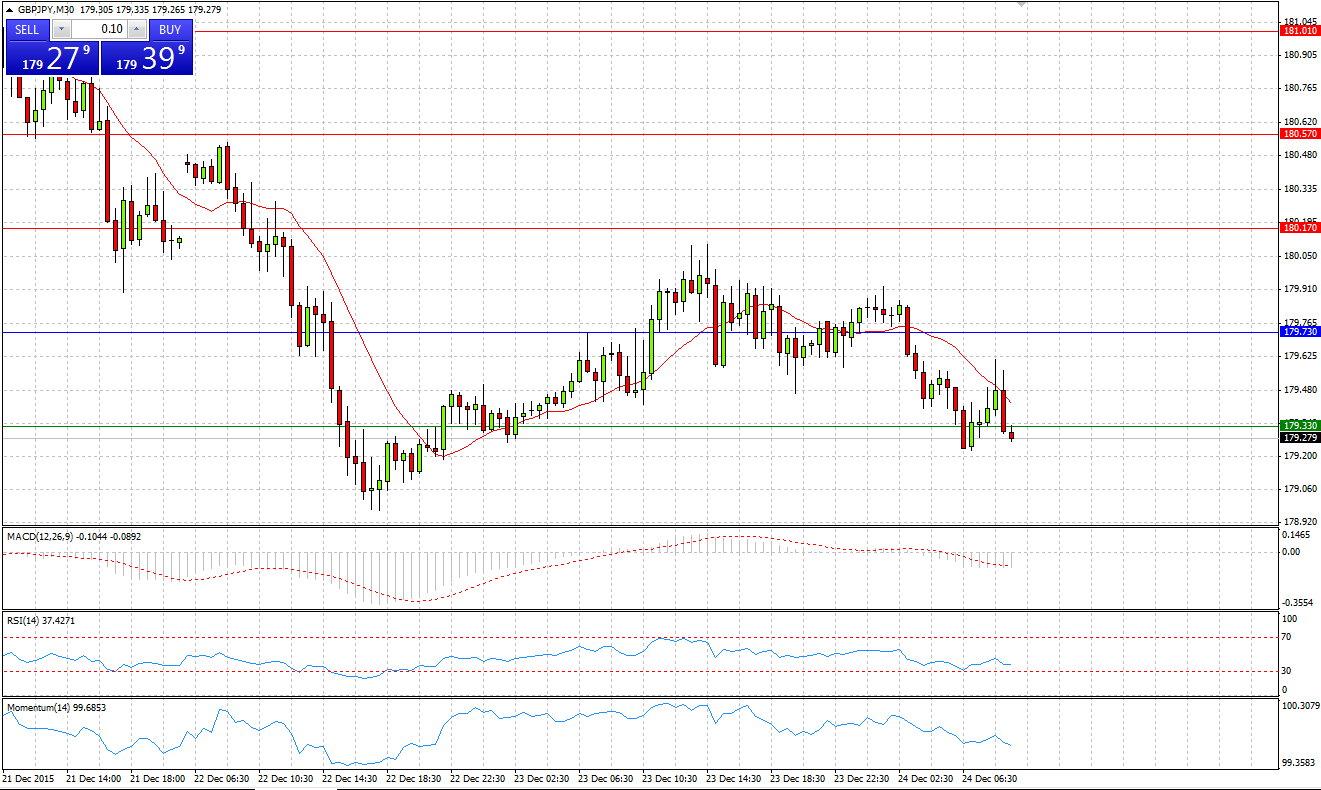
Market Scenario 1: Long positions above 179.73 with targets at 180.17 and 180.57
Market Scenario 2: Short positions below 179.73 with targets at 179.33 and 178.89
Comment: Sterling during yesterday’s session managed to close the day in the positive territory, first time in the last five sessions. However, today sterling resumed its downward move and gave away all the profit he managed gain during yesterday.
Supports and Resistances:
R3 181.01
R2 180.57
R1 180.17
PP 179.73
S1 179.33
S2 178.89
S3 178.49
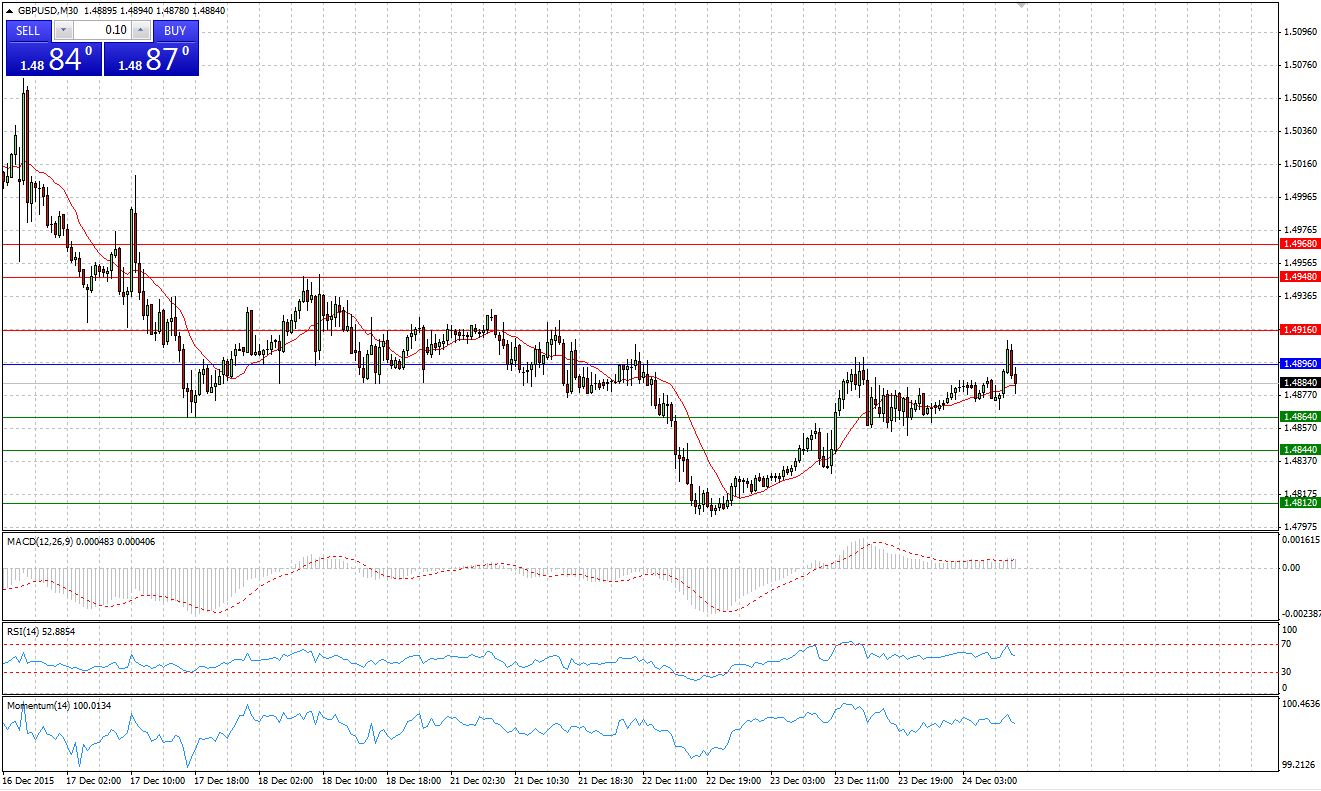
Market Scenario 1: Long positions above 1.4861 with targets at 1.4905 and 1.4942
Market Scenario 2: Short positions below 1.4861 with targets at 1.4824 and 1.4780
Comment: Having dropped to its lowest level at 1.4804 during Tuesday’s session, sterling found solid ground and managed to close Wednesday’s session in positive territory regaining most of the Tuesday’s losses. Today sterling continues appreciating against US dollar and even undertook an attempt to break through the first Resistance level.
Supports and Resistances:
R3 1.4986
R2 1.4942
R1 1.4905
PP 1.4861
S1 1.4824
S2 1.4780
S3 1.4743
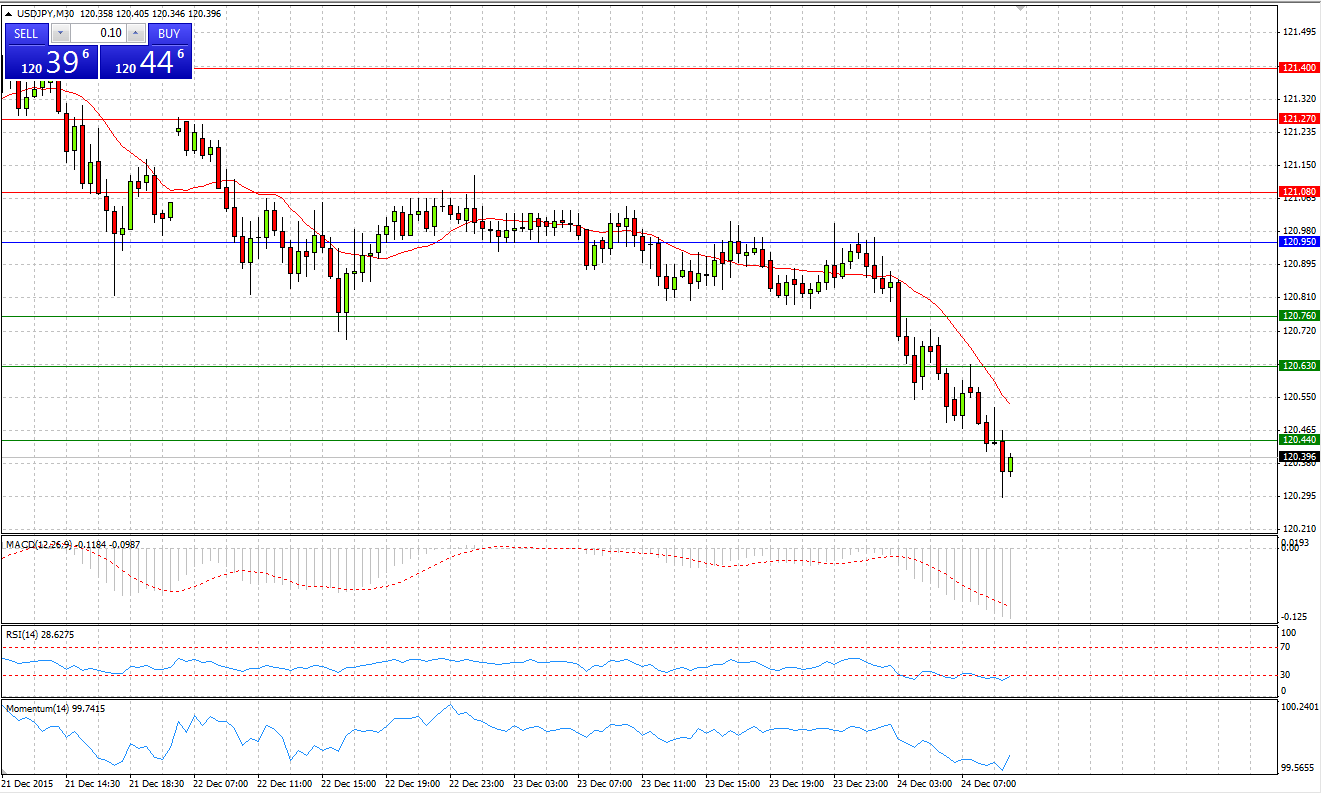
Market Scenario 1: Long positions above 120.95 with targets at 121.08 and 121.27
Market Scenario 2: Short positions below 120.95 with targets at 120.76 and 120.63
Comment: US dollar continues trading under pressure against Japanese yen recording 4th day in the row of consecutive losses. Today the pair broke reached a new low at 120.29, the lowest level since 28 of October.
Supports and Resistances:
R3 121.40
R2 121.27
R1 121.08
PP 120.95
S1 120.76
S2 120.63
S3 120.44
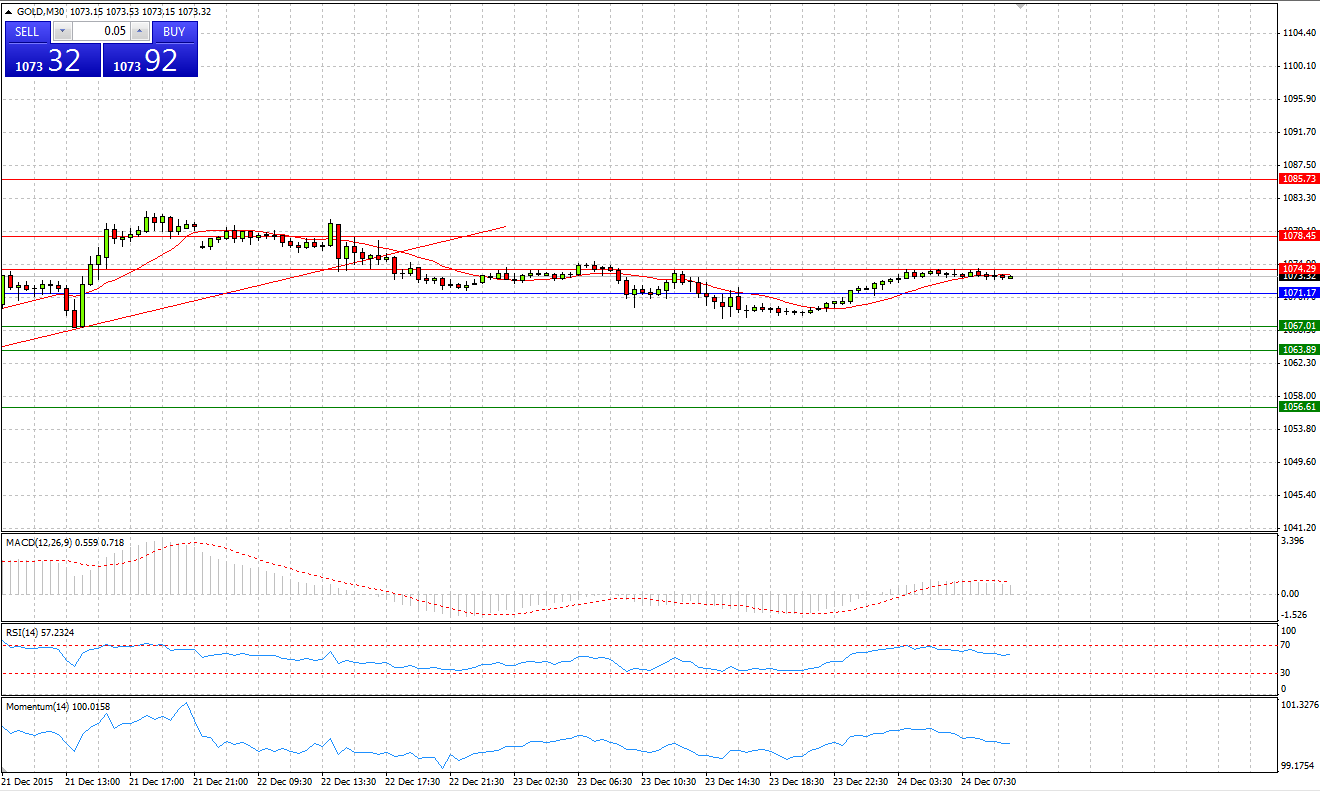
GOLD
Market Scenario 1: Long positions above 1071.17 with targets at 1074.29 and 1078.45
Market Scenario 2: Short positions below 1071.17 with targets at 1067.01 and 1063.89
Comment: Gold closed yesterday’s session in negative territory, for the second day in a row. However, in the bigger picture, gold is trading in the range between 1085.50 and 1047.75. Range -Bound strategy can be applied.
Supports and Resistances:
R3 1085.73
R2 1078.45
R1 1074.29
PP 1071.17
S1 1067.01
S2 1063.89
S3 1056.61
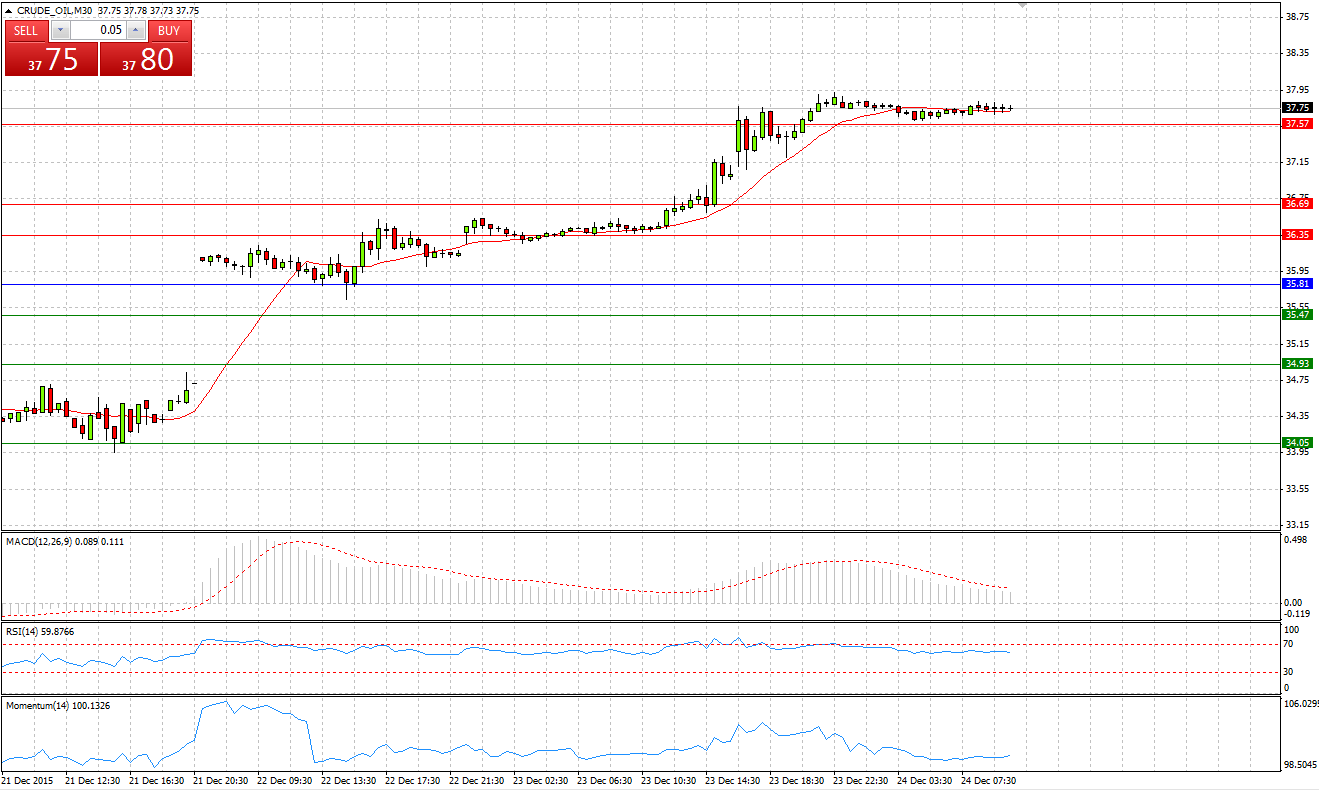
CRUDE OIL
Market Scenario 1: Long positions above 37.35 with targets at 38.44 and 39.01
Market Scenario 2: Short positions below 37.35 with targets at 36.78 and 35.69
Comment: Crude oil amid unexpected decrease of US Crude Oil inventories from anticipated 4.8M to 1.4M, dropped to -5.9M. Crude may continue its upwards move in the next few sessions, however, it is important to take into account that supply still exceeds the demand.
Supports and Resistances:
R3 40.67
R2 39.01
R1 38.44
PP 37.35
S1 36.78
S2 35.69
S3 34.03
USD/RUB
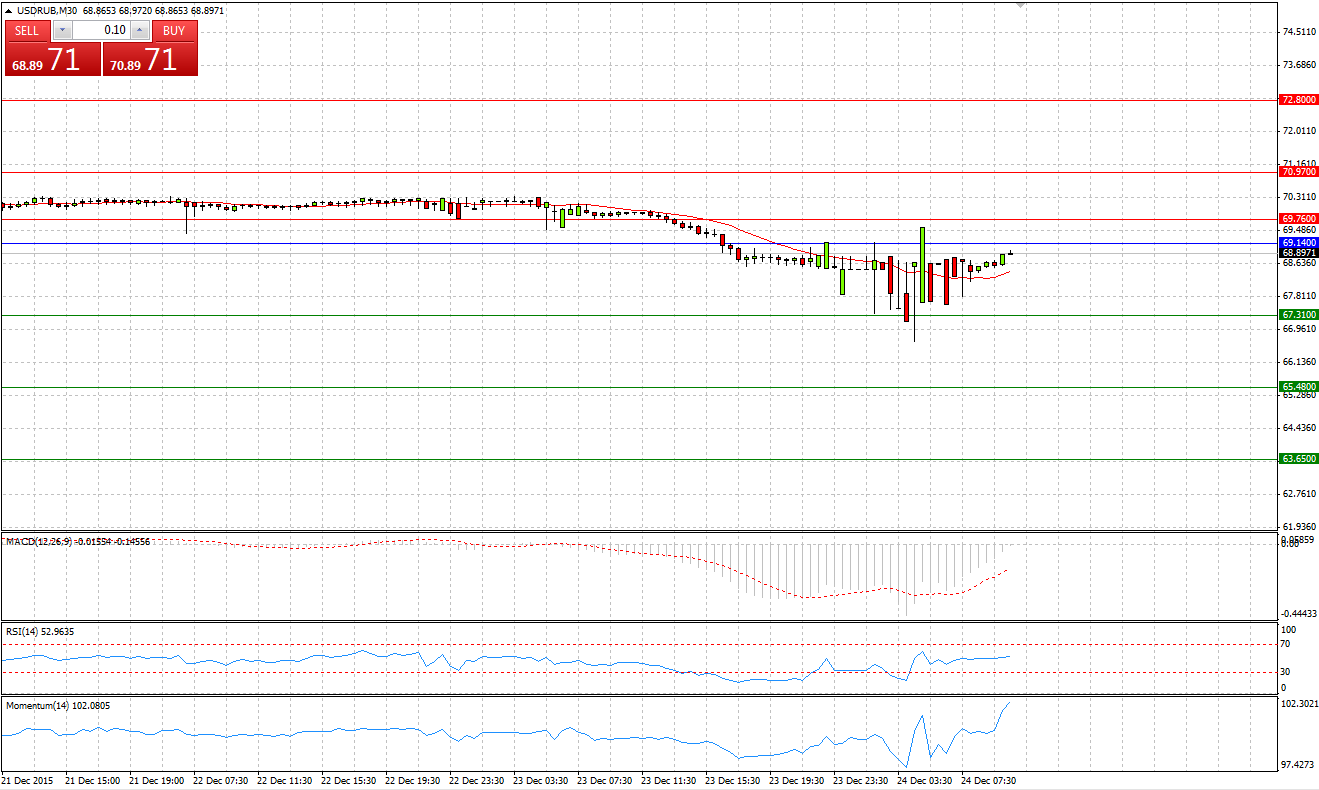
Market Scenario 1: Long positions above 69.14 with targets at 69.76 and 70.97
Market Scenario 2: Short positions below 69.14 with targets at 67.31 and 65.48
Comment: USD/RUB came under selling pressure amid improved oil prices and closed the day at 68.56, significantly below psychologically important level of 70 Russian rubles per US dollar. Today Bear undertook an attempt to send the pair even lower, reaching 66.66; however, bulls took back the control and now the pair is trading at 68.87.
Supports and Resistances:
R3 72.80
R2 70.97
R1 69.76
PP 69.14
S1 67.31
S2 65.48
S3 63.65
