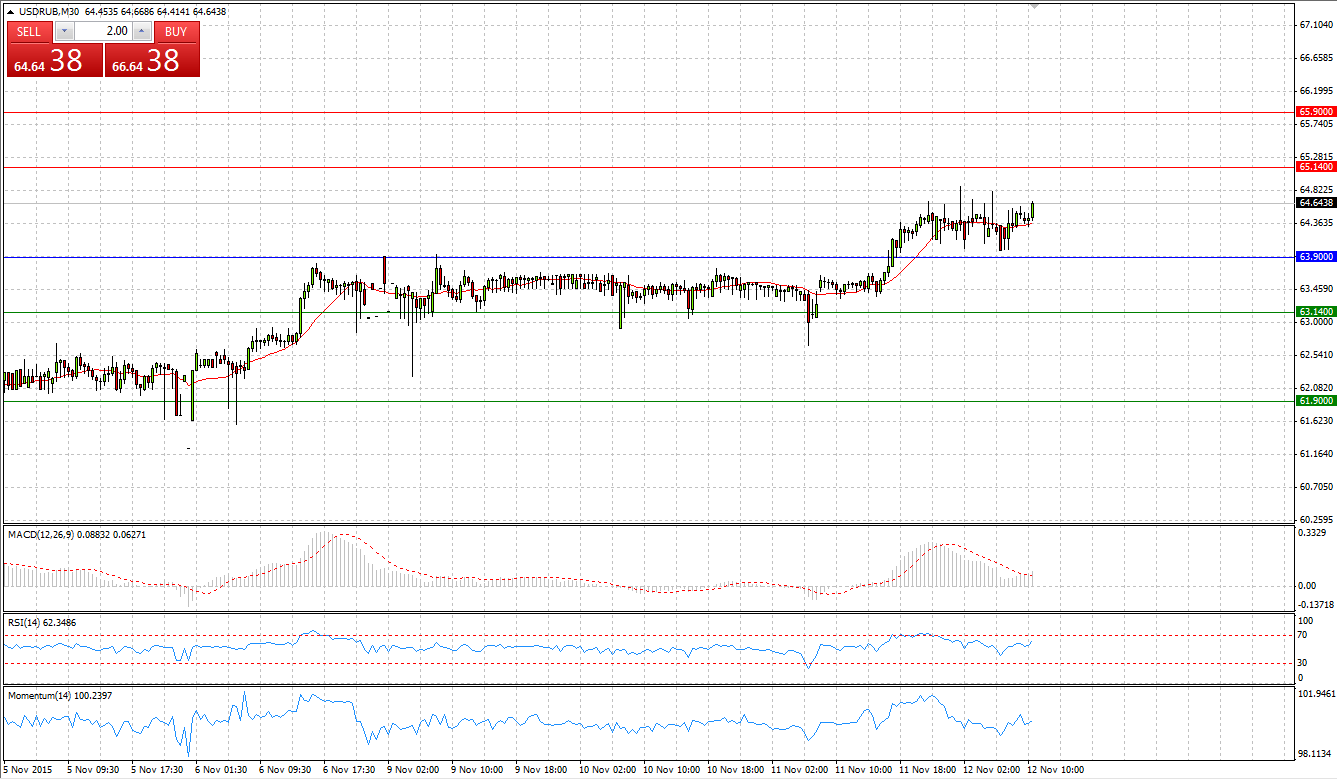
*All the charts are 30M charts with daily pivot points.
Market Scenario 1: Long positions above 0.7107 with targets at 0.7137 and 0.72
Market Scenario 2: Short positions below 0.7084 with targets at 0.7054 and 0.7031
Comment: Aussie appreciated against US dollar for almost 100 pips within half an hour amid surprising figures from Australia’s employment change and Unemployment Rate, which improved from 6.2% to 5.9%. AUD/USD had already broke through the all Resistance level for today and is currently trading around 0.715.
Supports and Resistances:
R3 0.7137
R2 0.7107
R1 0.7084
PP 0.7054
S1 0.7031
S2 0.7001
S3 0.6978
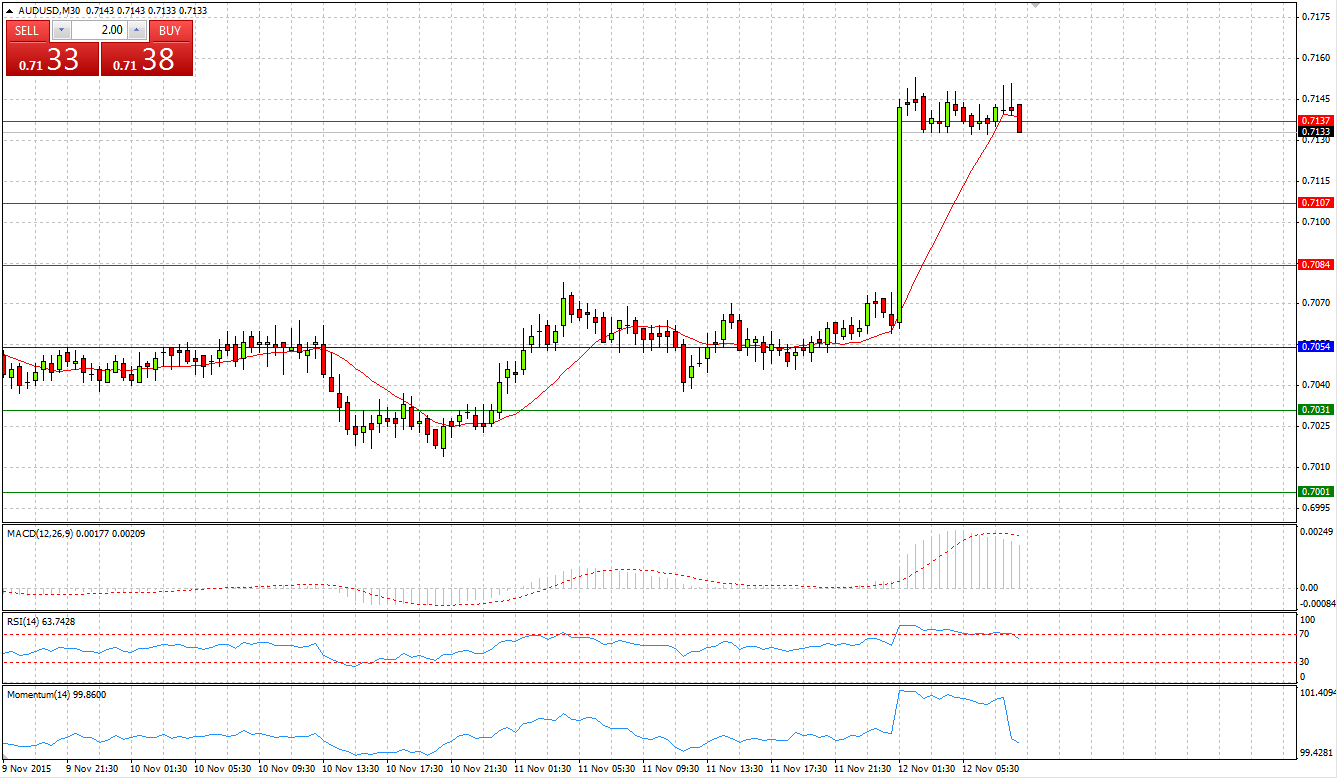
Market Scenario 1: Long positions above 131.61 with targets at 132.36 and 132.76
Market Scenario 2: Short positions below 132.76 with targets at 132.01 and 131.61
Comment: European currency continues trading in the range against Japanese yen, closing yesterday’s session with no change. Range Bound Strategy can be applied between R2 and S1. However, if pair break through S1, further depreciation might take place.
Supports and Resistances:
R3 133.11
R2 132.76
R1 132.36
PP 132.01
S1 131.61
S2 131.26
S3 130.86
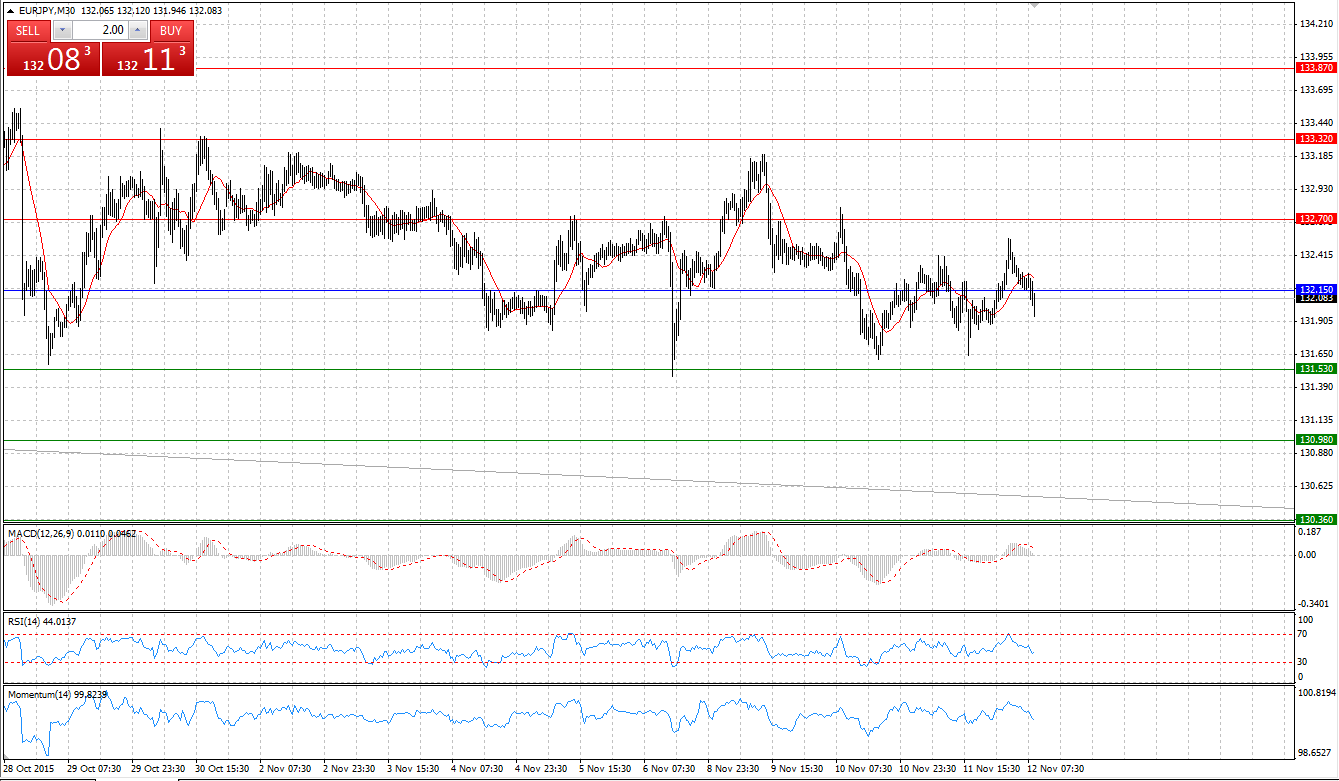
Market Scenario 1: Long positions above 1.0752 with targets at 1.0786 and 1.0822
Market Scenario 2: Short positions below 1.0752 with targets at 1.0716 and 1.0682
Comment: European currency was trading in the range against US dollar, ahead of the speech ECB President Mario Draghi, US Unemployment Claims and speech of Fed Chair Yellen. During Draghi's speech, which was very dovish, the pair came under selling pressure and broke through the First Support level, aiming to test the Second one.
Supports and Resistances:
R3 1.0842
R2 1.0808
R1 1.0774
PP 1.0740
S1 1.0706
S2 1.0672
S3 1.0638
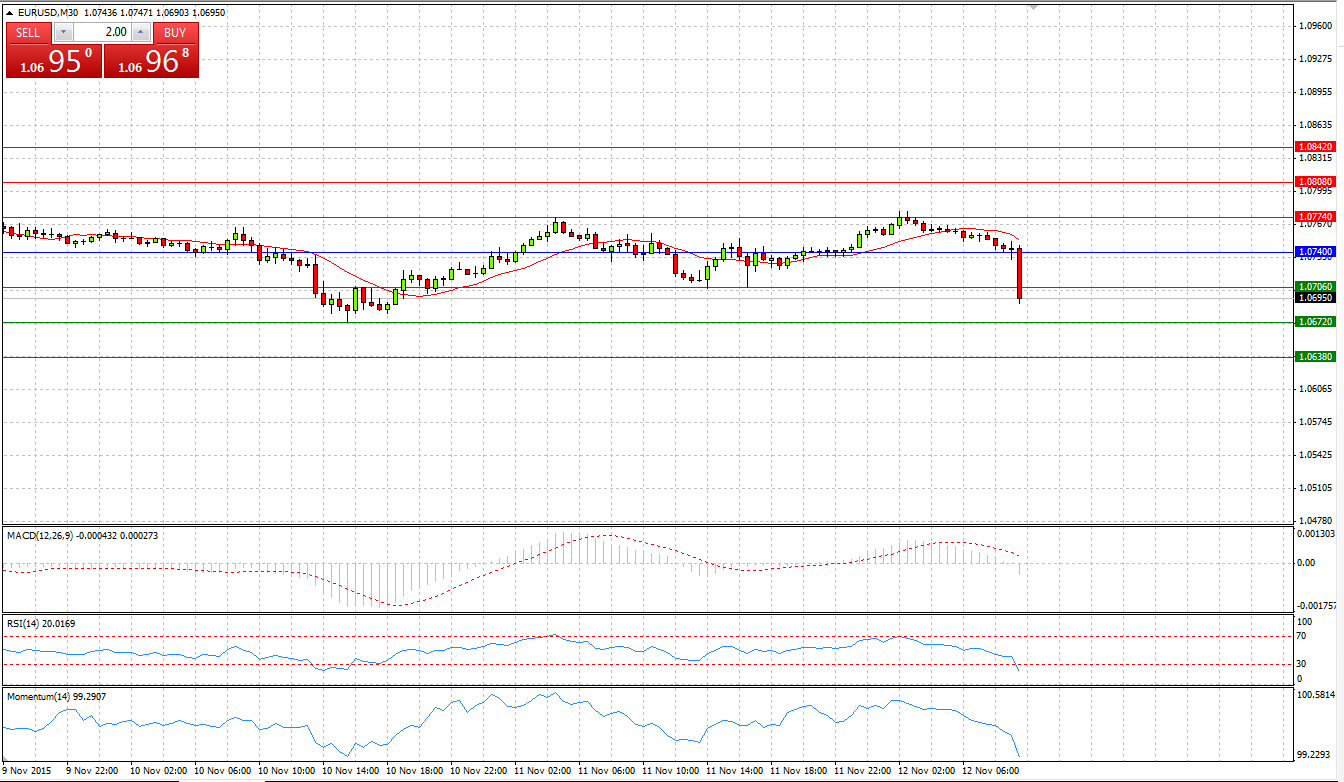
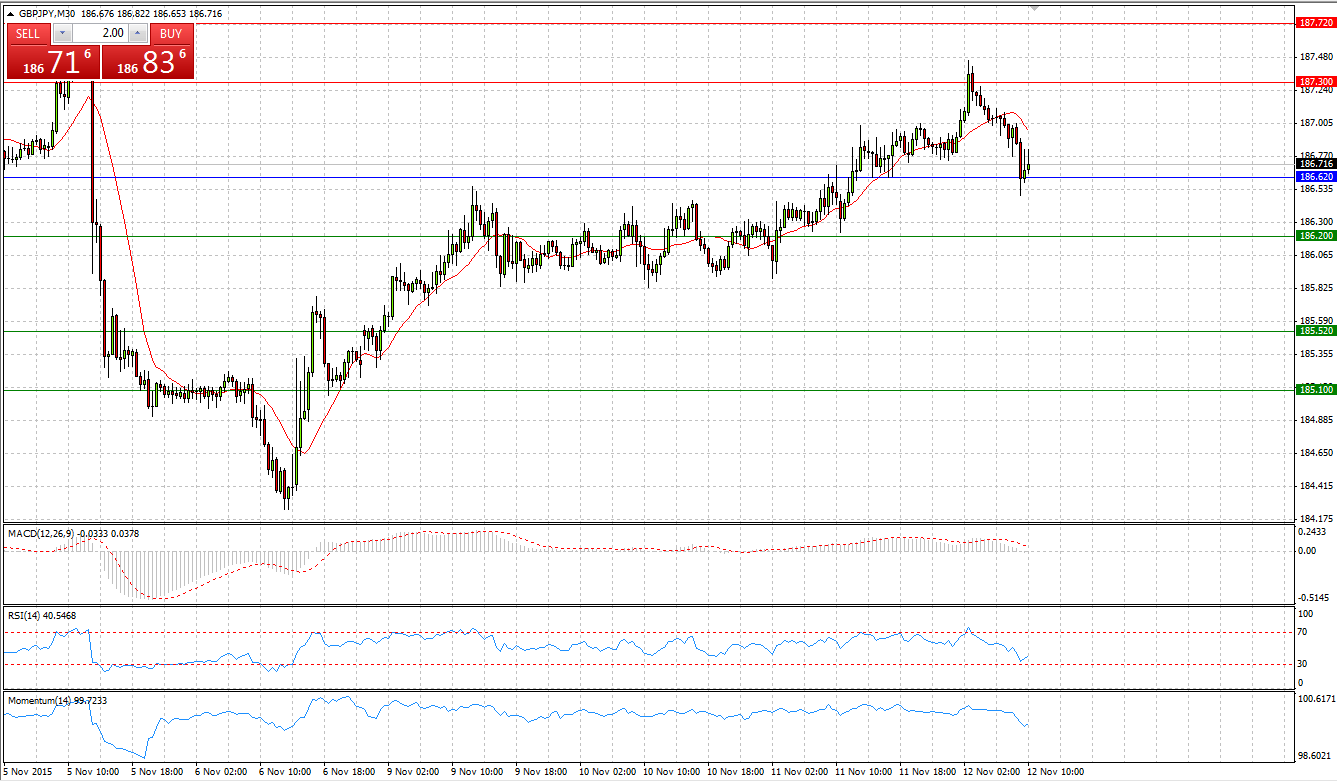
Market Scenario 1: Long positions above 186.19 with targets at 186.50 and 186.81
Market Scenario 2: Short positions below 186.19 with targets at 185.88 and 185.57
Comment: Sterling managed to close another day of gains, the 4th one in a row against Japanese yen, returning all the losses incurred during 5th of November’ sell-off. During early Asian session, the pair reached 187.45, which is only 21 pips away from its highest level reached on the 5th of November.
Supports and Resistances:
R3 188.40
R2 187.72
R1 187.30
PP 186.62
S1 186.20
S2 185.52
S3 185.10
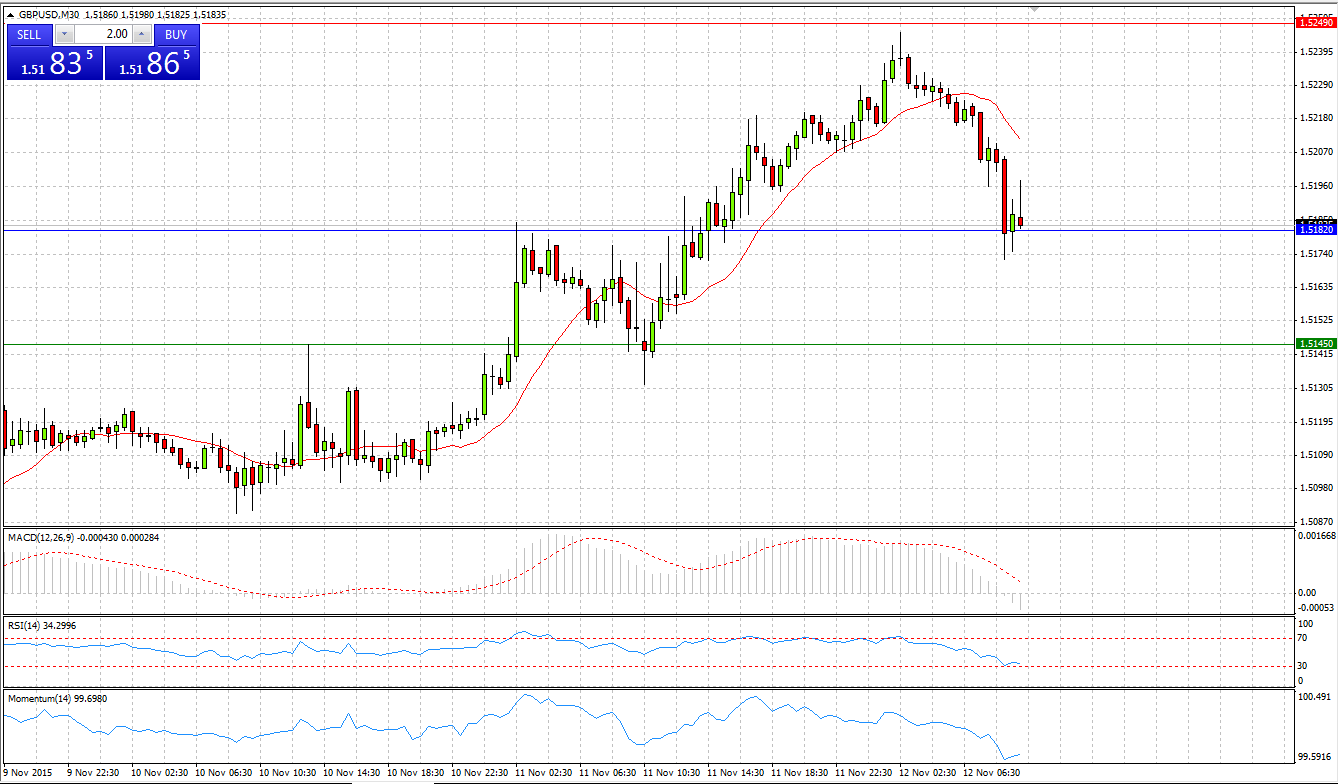
GBP/USD
Market Scenario 1: Long positions above 1.5182 with targets at 1.5249 and 1.5286
Market Scenario 2: Short positions below 1.5182 with targets at 1.5145 and 1.5078
Comment: Sterling closed the third day in the row in positive territory against US dollar, amid improved UK’s unemployment figures. UK unemployment rate declined to 5.3% the lowest since the spring of 2008. Currently, GBP/USD is trading above Pivot Point level, which acts as a support level.
Supports and Resistances:
R3 1.5353
R2 1.5286
R1 1.5249
PP 1.5182
S1 1.5145
S2 1.5078
S3 1.5041
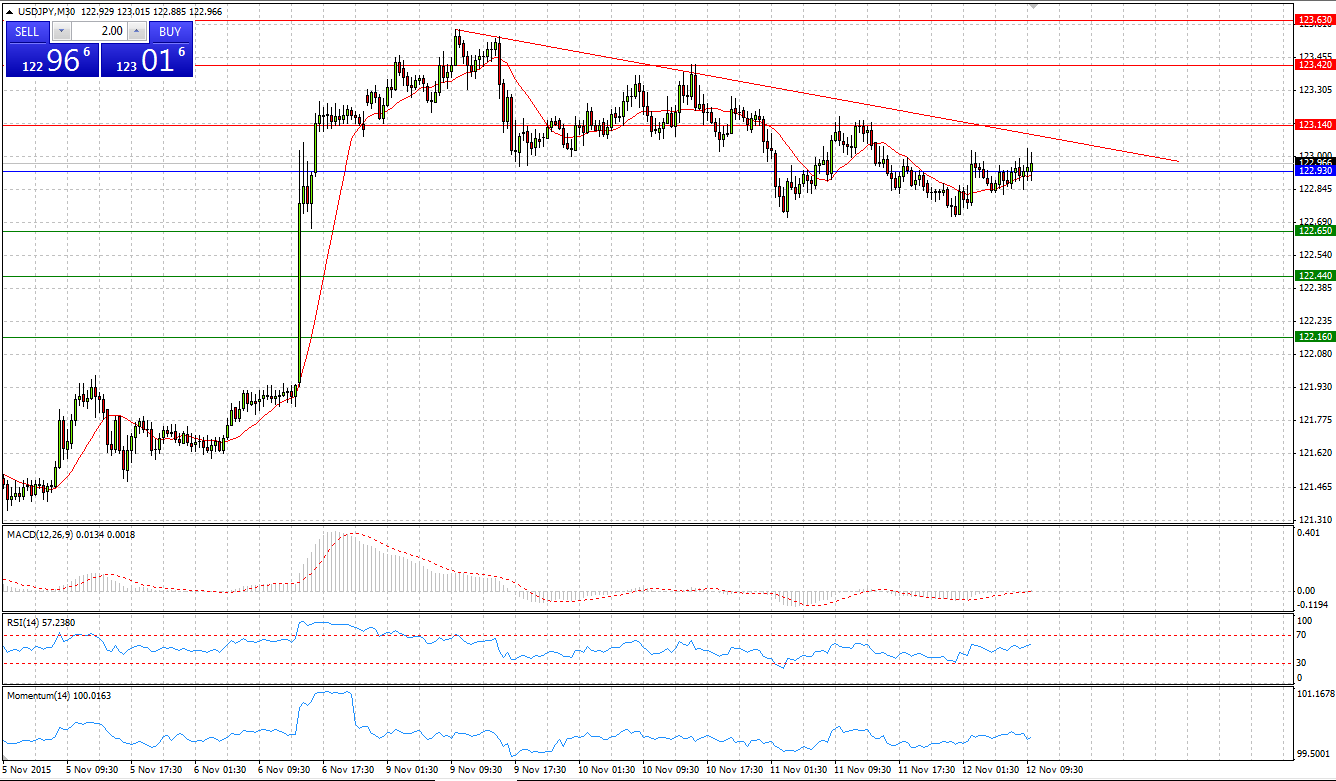
USD/JPY
Market Scenario 1: Long positions above 122.93 with targets at 123.14 and 123.42
Market Scenario 2: Short positions below 122.93 with targets at 122.65 and 122.44
Comment: After USD’s rally on the 6th of November against Japanese yen, and the USD/JPY appreciating for more than 150 pips per one day, the pair entered into consolidation area. If the pair manages to break through the First Resistance level, it may open the way for additional tests of the highs.
Supports and Resistances:
R3 123.63
R2 123.42
R1 123.14
PP 122.93
S1 122.65
S2 122.44
S3 122.16
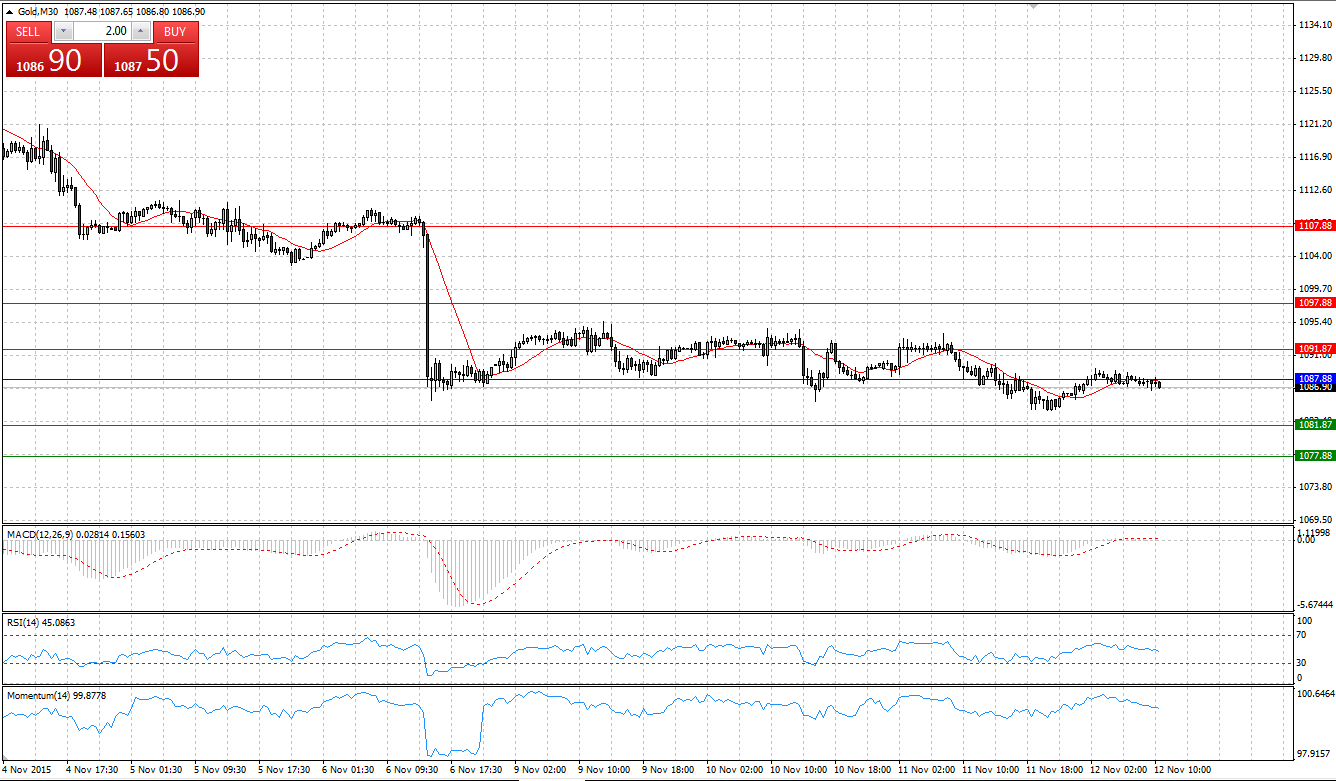
GOLD
Market Scenario 1: Long positions above 1087.88 with targets at 1091.87 and 1097.88
Market Scenario 2: Short positions below 1087.88 with targets at 1081.87 and 1077.88
Comment: Gold during yesterday’s session reached a new low at 1083.90, the lowest level since 7th of August. The gold is trading 6 USD away from the S1, which is a strong resistance level as it managed to withhold and push gold prices higher during the period of end of July and the beginning of August.
Supports and Resistances:
R3 1107.88
R2 1097.88
R1 1091.87
PP 1087.88
S1 1081.87
S2 1077.88
S3 1067.88
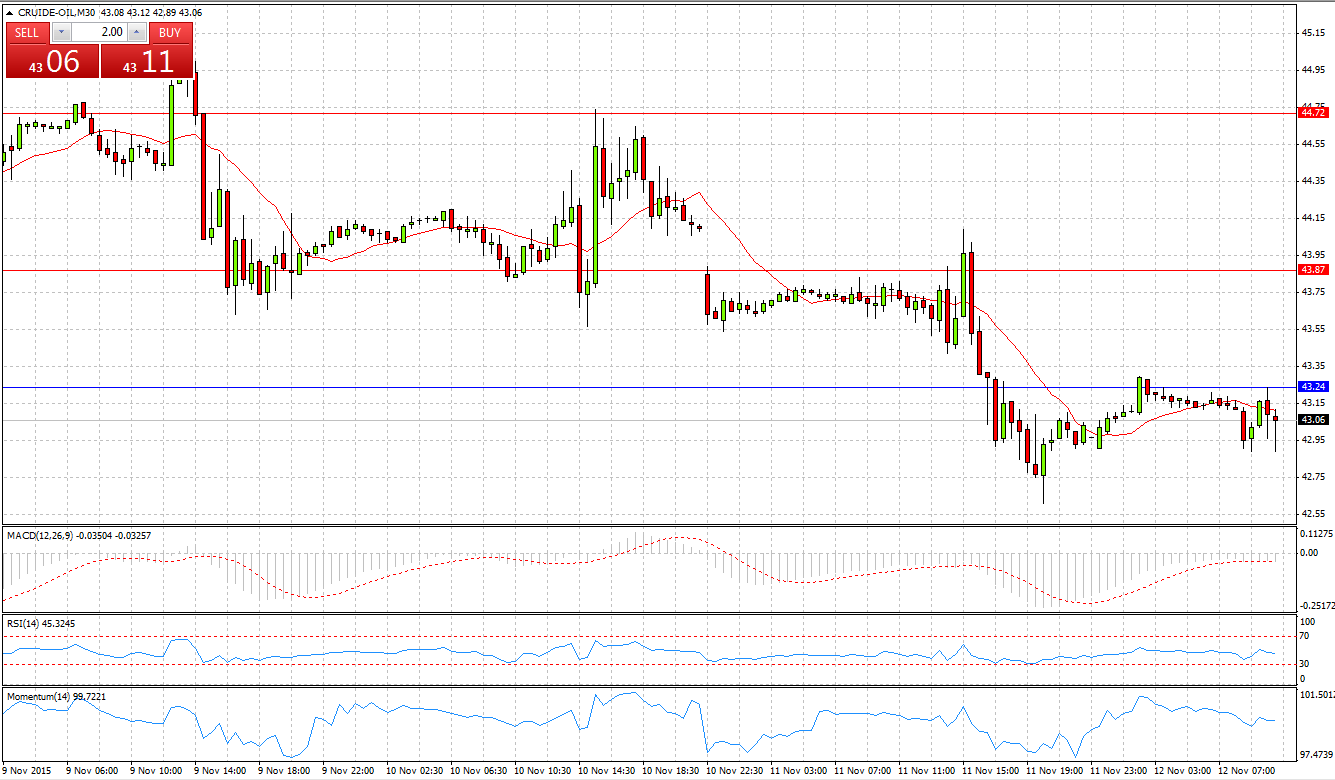
CRUDE OIL
Market Scenario 1: Long positions above 44.40 with targets at 44.75 and 45.45
Market Scenario 2: Short positions below 44.40 with targets at 43.70 and 43.35
Comment: Crude closed sixth day of consecutive losses against US dollar, falling to the low of 27th of October at 42.61. Currently crude felt below Pivot Point level aiming to test the First Support level.
Supports and Resistances:
R3 46.20
R2 44.72
R1 43.87
PP 43.24
S1 42.39
S2 41.76
S3 40.28
USD/RUB
Market Scenario 1: Long positions above 63.90 with targets at 65.14 and 65.90
Market Scenario 2: Short positions below 63.90 with targets at 63.14 and 61.90
Comment: USD/RUB reached a new high during yesterday’s session at 64.67. At the time being, the pair is trading well above Pivot point level close to R1.
Supports and Resistances:
R3 67.90
R2 65.90
R1 65.14
PP 63.90
S1 63.14
S2 61.90
S3 59.90
