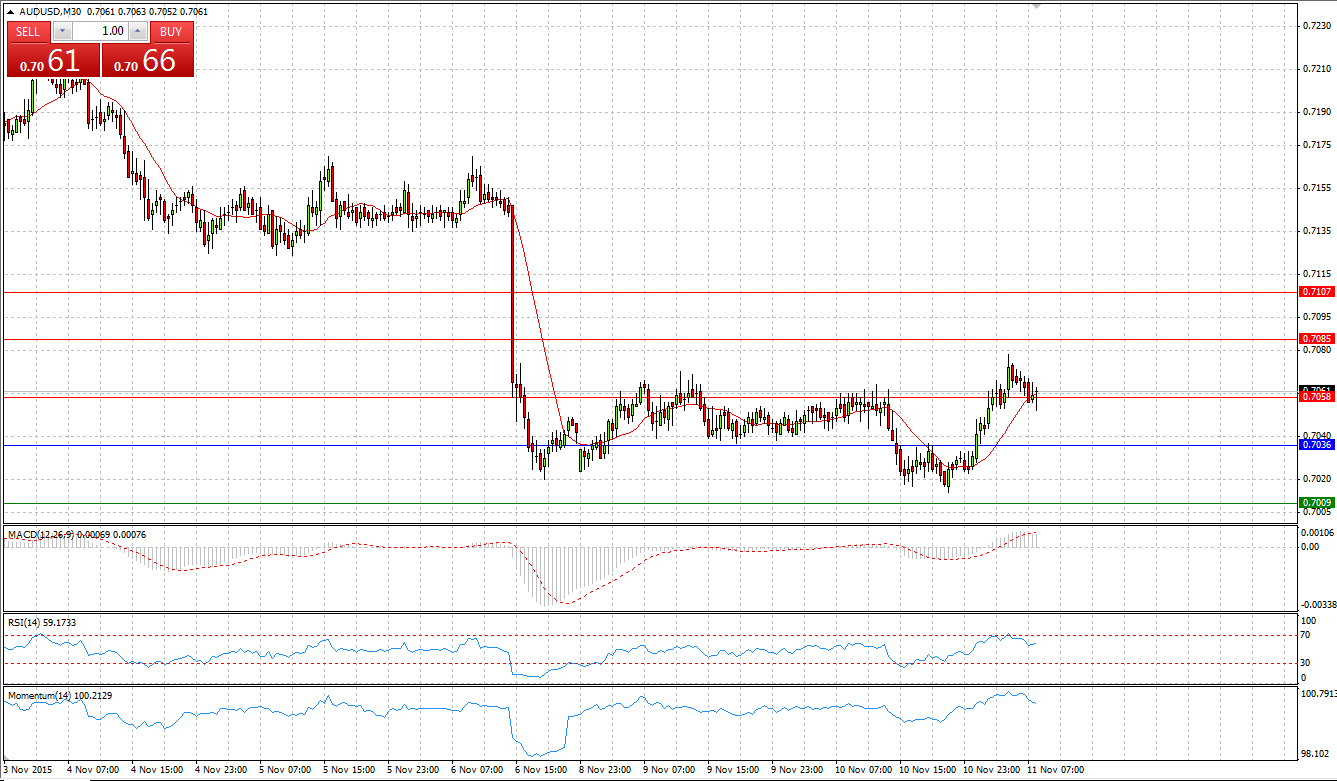
Market Scenario 1: Long positions above 0.7036 with targets at 0.7058 and 0.7085
Market Scenario 2: Short positions below 0.7036 with targets at 0.7009 and 0.6987
Comment: Aussie during early Asian session broke through the First Resistance level and almost reached the Second one against US dollar. However, due to selling pressure, AUD/USD was pushed back to R1. At the time being, the pair is trading above R1, which acts now as a Support level.
Supports and Resistances:
R3 0.7107
R2 0.7085
R1 0.7058
PP 0.7036
S1 0.7009
S2 0.6987
S3 0.6960
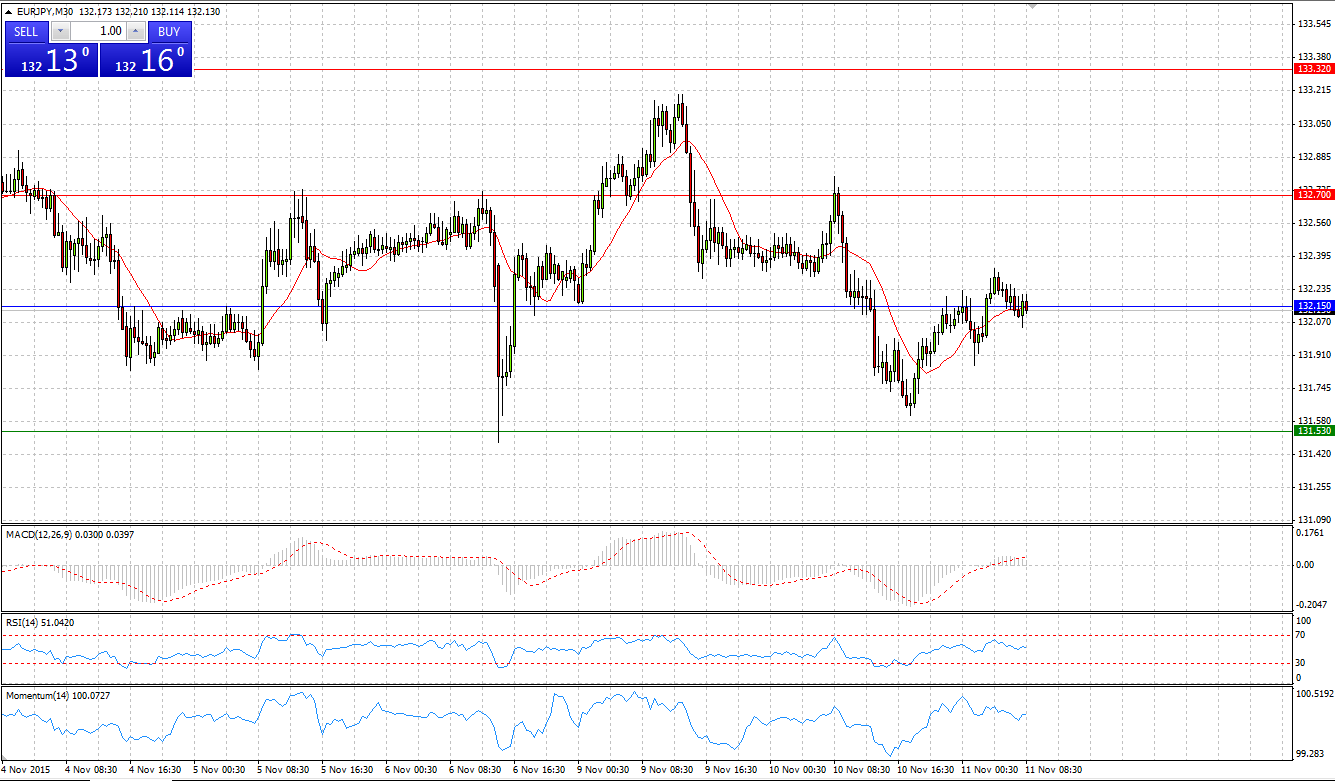
Market Scenario 1: Long positions above 131.53 with targets at 132.15 and 132.70
Market Scenario 2: Short positions below 132.70 with targets at 132.15 and 131.53
Comment: European currency is trading in the range against Japanese yen between S1 and R1 since 29th of October. If bears succeed to push the pair below the First Support level, the pair may continue its downward move.
Supports and Resistances:
R3 133.87
R2 133.32
R1 132.70
PP 132.15
S1 131.53
S2 130.98
S3 130.36
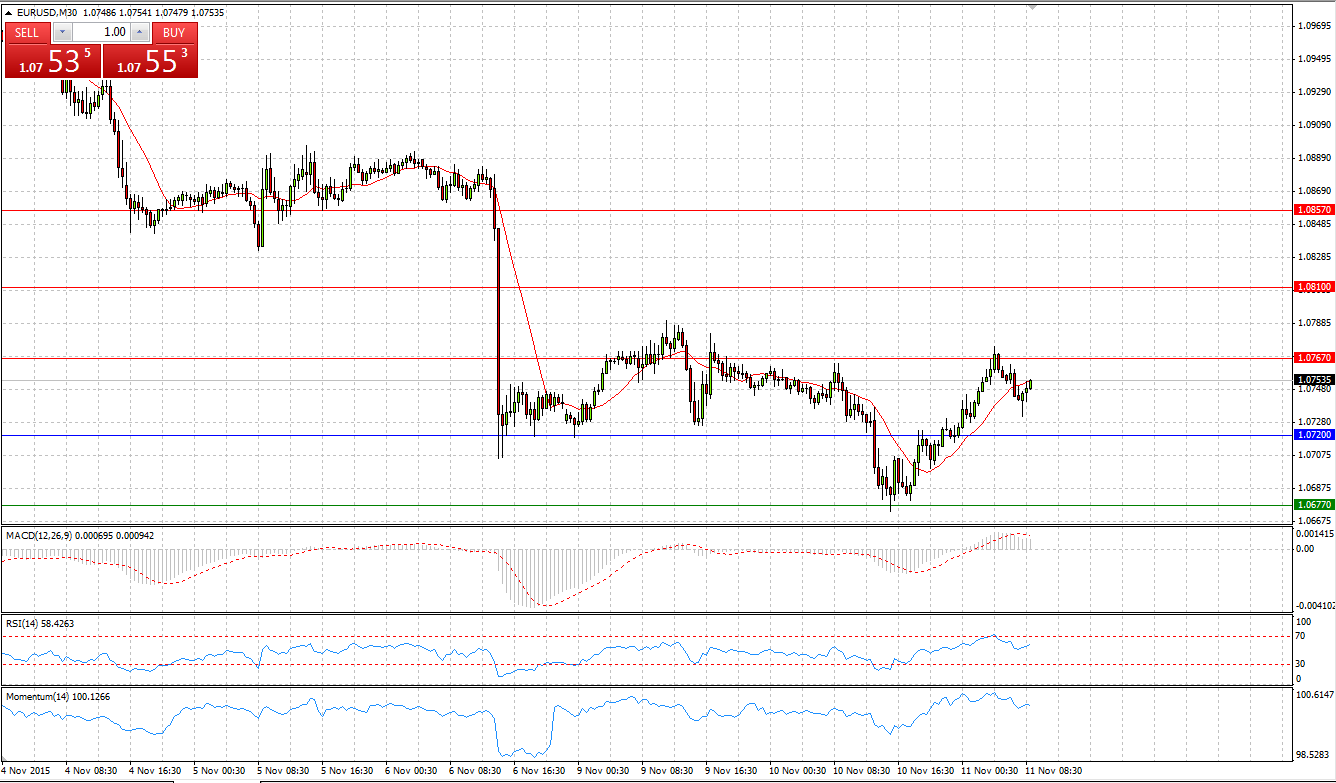
EUR/USD
Market Scenario 1: Long positions above 1.0752 with targets at 1.0786 and 1.0822
Market Scenario 2: Short positions below 1.0752 with targets at 1.0716 and 1.0682
Comment: Having sunk to its lowest level at 1.0673 during yesterday’s session, European currency managed to return some of the losses against US dollar closing the day above 1.07. Today EUR/USD is trading positively above Pivot Point level.
Supports and Resistances:
R3 1.0857
R2 1.0810
R1 1.0767
PP 1.0720
S1 1.0677
S2 1.0630
S3 1.0587
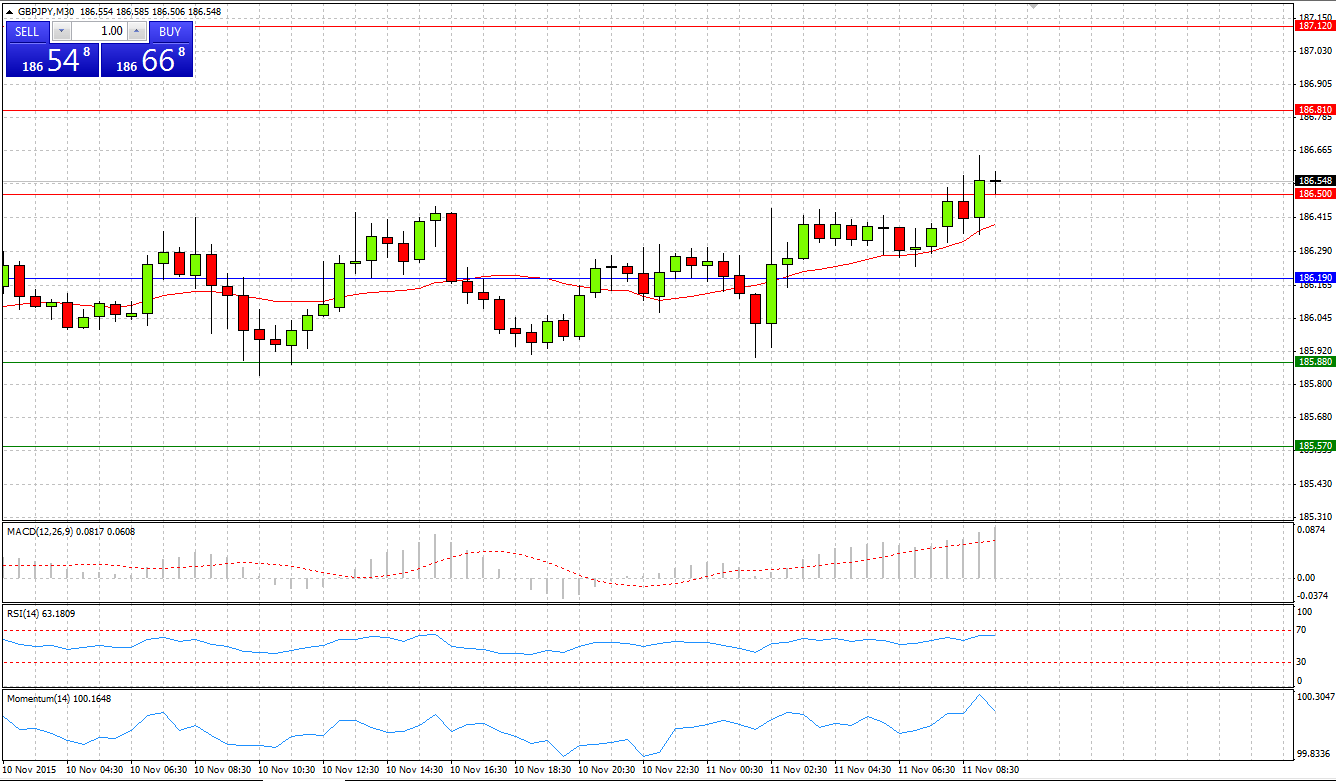
GBP/JPY
Market Scenario 1: Long positions above 186.19 with targets at 186.50 and 186.81
Market Scenario 2: Short positions below 186.19 with targets at 185.88 and 185.57
Comment: Sterling continues climbing towards its highs against Japanese yen, recording 4th day of gains. Today, GBP/JPY already managed to break through the First Resistance level and is aiming to the Second one.
Supports and Resistances:
R3 187.12
R2 186.81
R1 186.50
PP 186.19
S1 185.88
S2 185.57
S3 185.26
GBP/USD
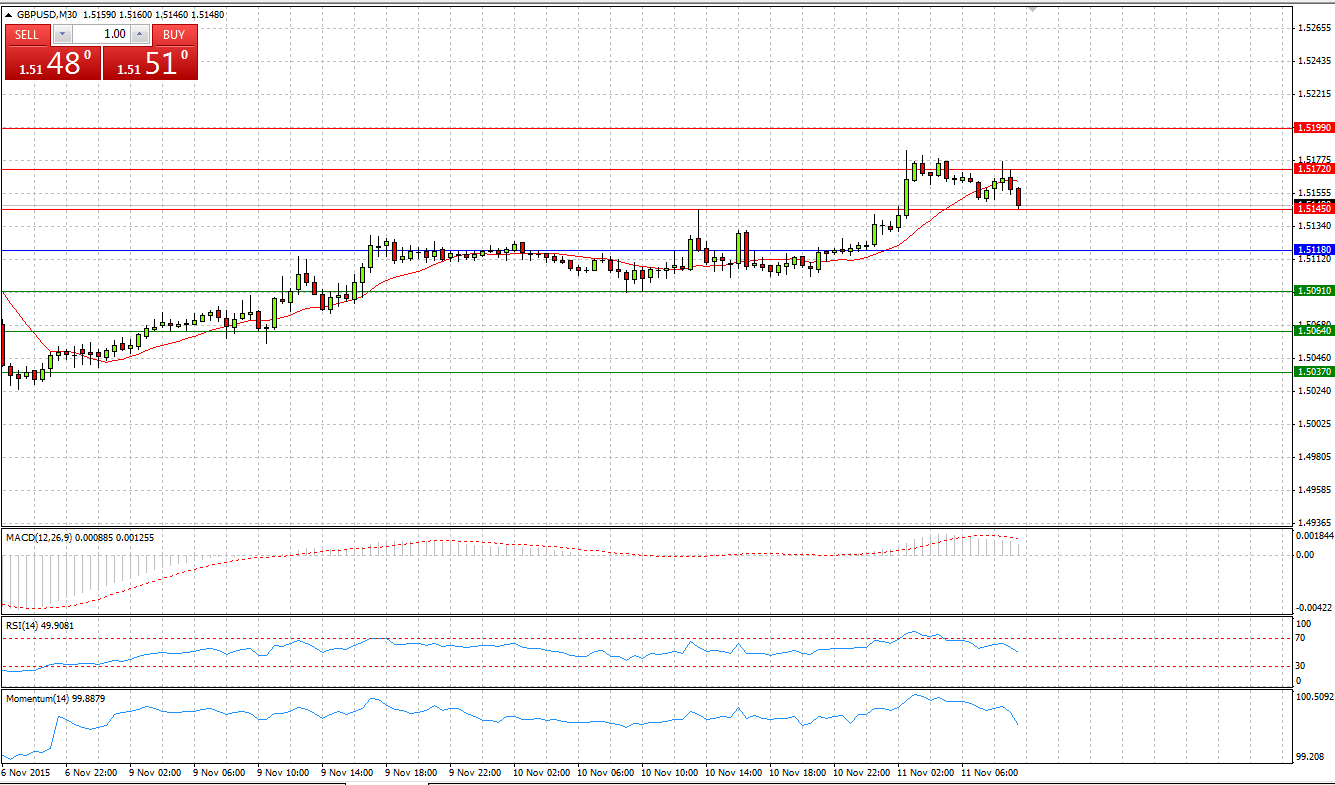
Market Scenario 1: Long positions above 1.5118 with targets at 1.5145 and 1.5172
Market Scenario 2: Short positions below 1.5118 with targets at 1.5091 and 1.5064
Comment: Sterling continues regaining the losses against US dollar, closing yesterday’s session slightly on a positive side. Today, having gathered support at Pivot Point level, GBP/USD managed to break through the First Resistance level and even tested the Second one.
Supports and Resistances:
R3 1.5199
R2 1.5172
R1 1.5145
PP 1.5118
S1 1.5091
S2 1.5064
S3 1.5037
USD/JPY
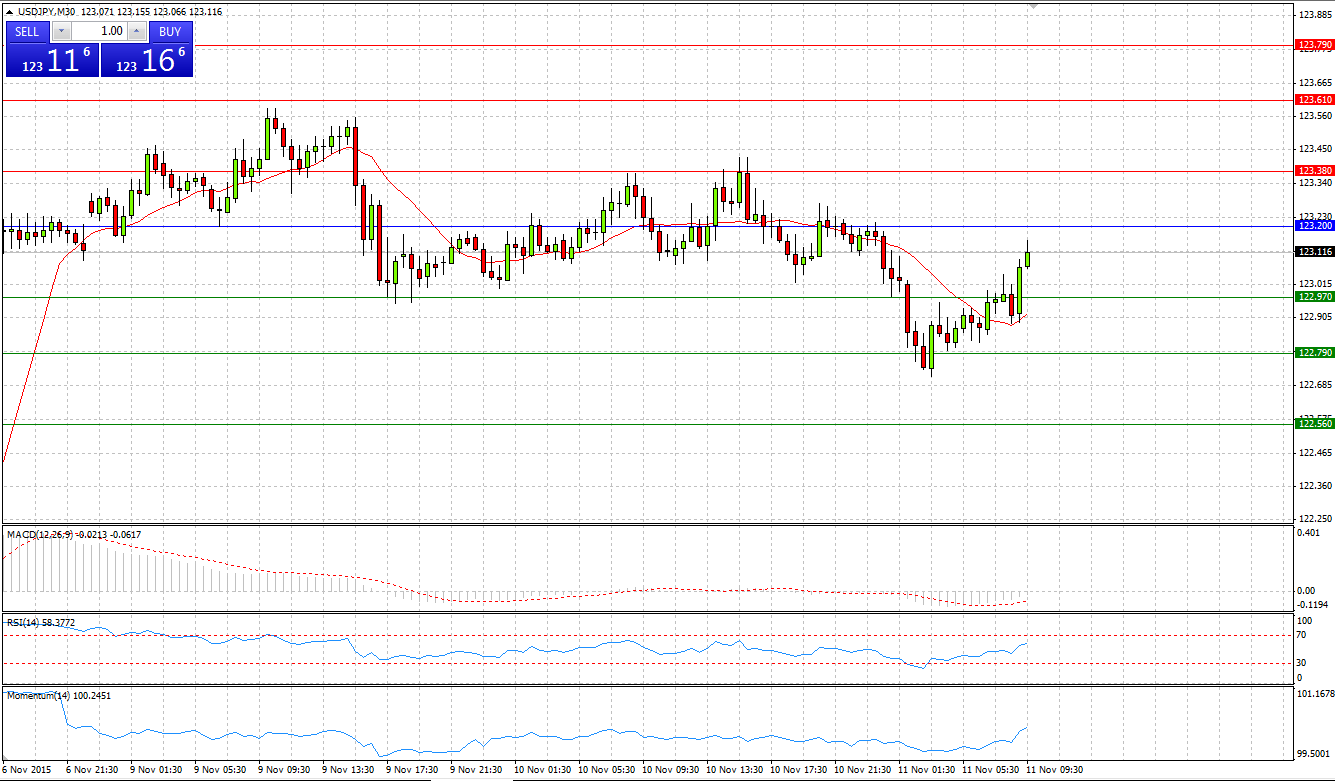
Market Scenario 1: Long positions above 123.20 with targets at 123.38 and 123.61
Market Scenario 2: Short positions below 123.20 with targets at 122.97 and 122.79
Comment: During early Asian session USD/JPY sunk below the second Support level. However, by the start of European session, the pair managed to return all losses and it progressively is trading close to Pivot Point level. Succeeded to break through PP, the pair may undertake an attempt to test its recent high, which stands close to R2 at 123.58
Supports and Resistances:
R3 123.79
R2 123.61
R1 123.38
PP 123.20
S1 122.97
S2 122.79
S3 122.56
GOLD
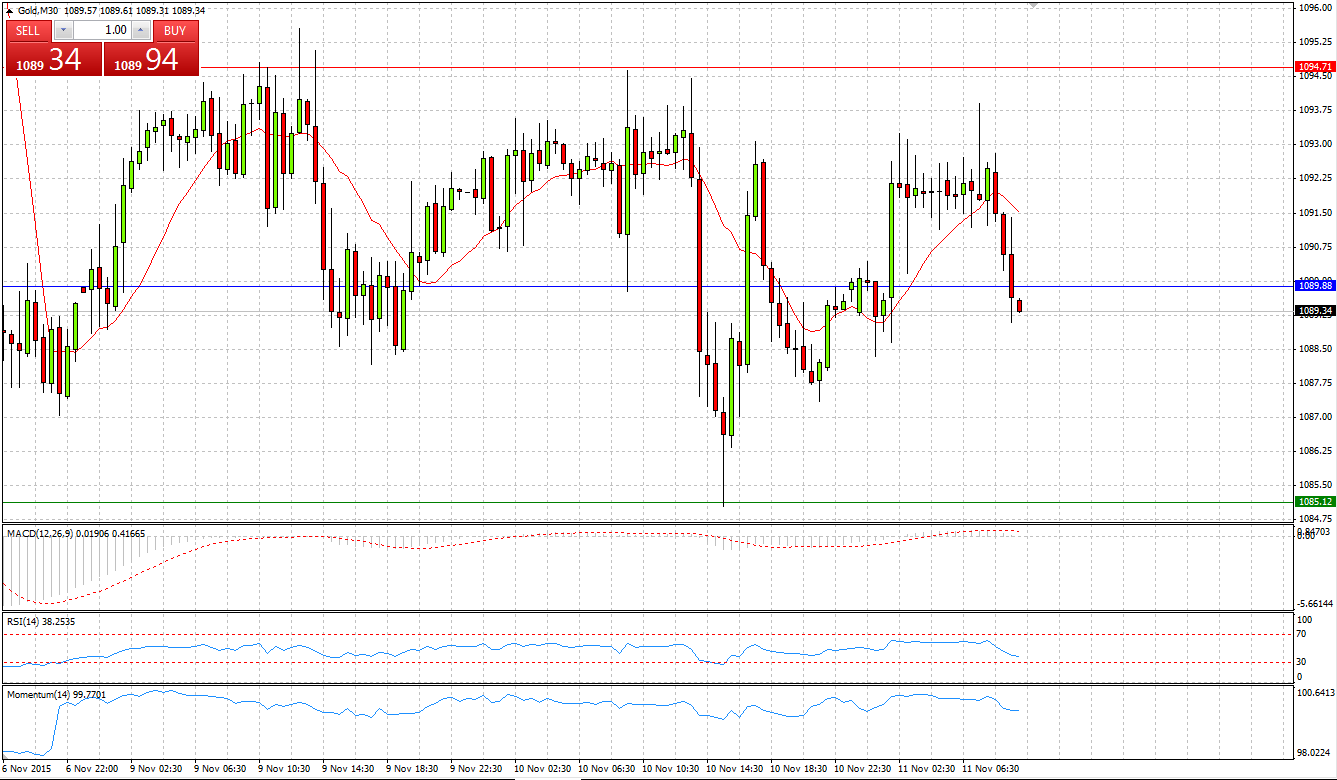
Market Scenario 1: Long positions above 1094.98 with targets at 1104.81 and 1120.11
Market Scenario 2: Short positions below 1094.98 with targets at 1079.68 and 1069.85
Comment: Gold is trading in the range close to its lows. During yesterday’s session, gold recorded a new low at 1085.04, 11 cents lower than on the 6th of November. Gold remains trading under pressure; if bears succeed to push it below the First Resistance level, it may test its lows reached on 4th of August at 1180.
Supports and Resistances:
R3 1109.06
R2 1099.47
R1 1094.71
PP 1089.88
S1 1085.12
S2 1080.29
S3 1070.70
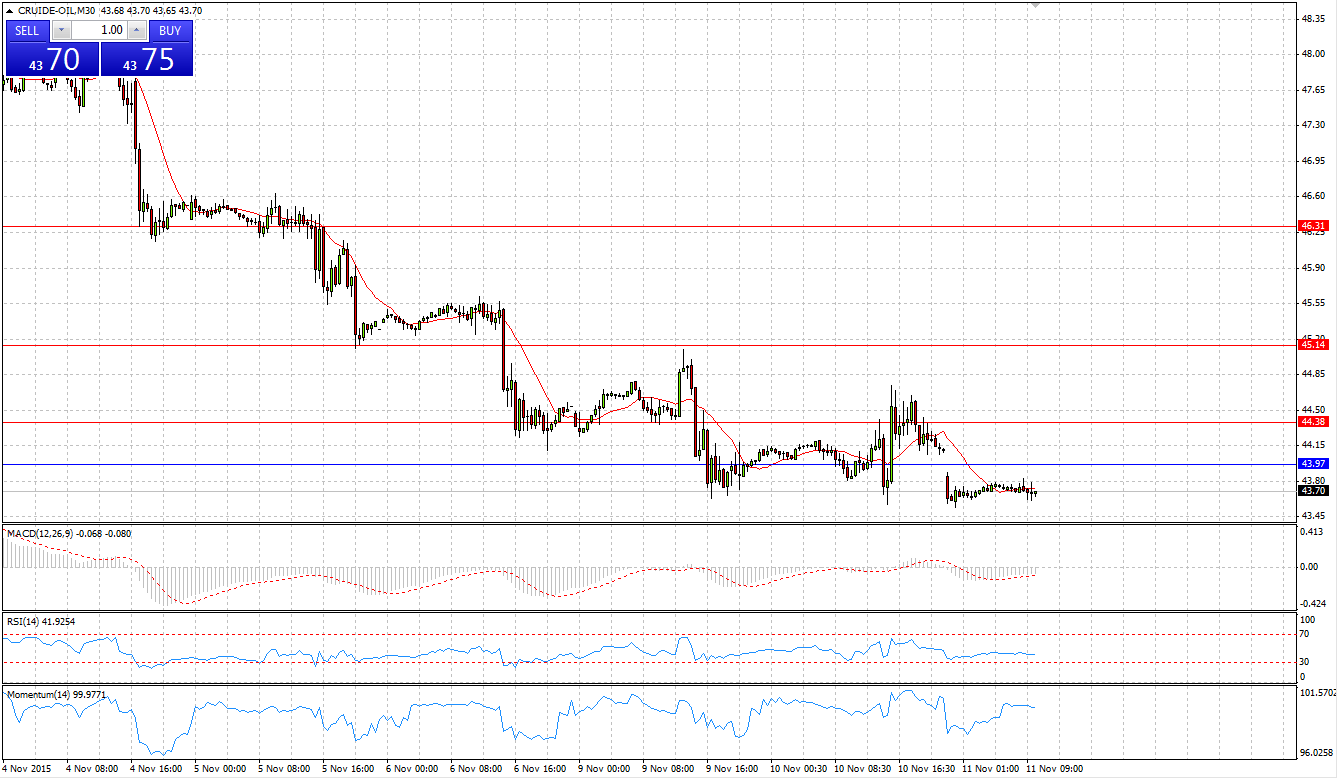
CRUDE OIL
Market Scenario 1: Long positions above 44.40 with targets at 44.75 and 45.45
Market Scenario 2: Short positions below 44.40 with targets at 43.70 and 43.35
Comment: For the fifth day in a row, crude has been sliding down against US dollar, ending yesterday’s session with a 45 cent loss. Currently crude is trading below Pivot Point level.
Supports and Resistances:
R3 46.31
R2 45.14
R1 44.38
PP 43.97
S1 43.21
S2 42.80
S3 41.63
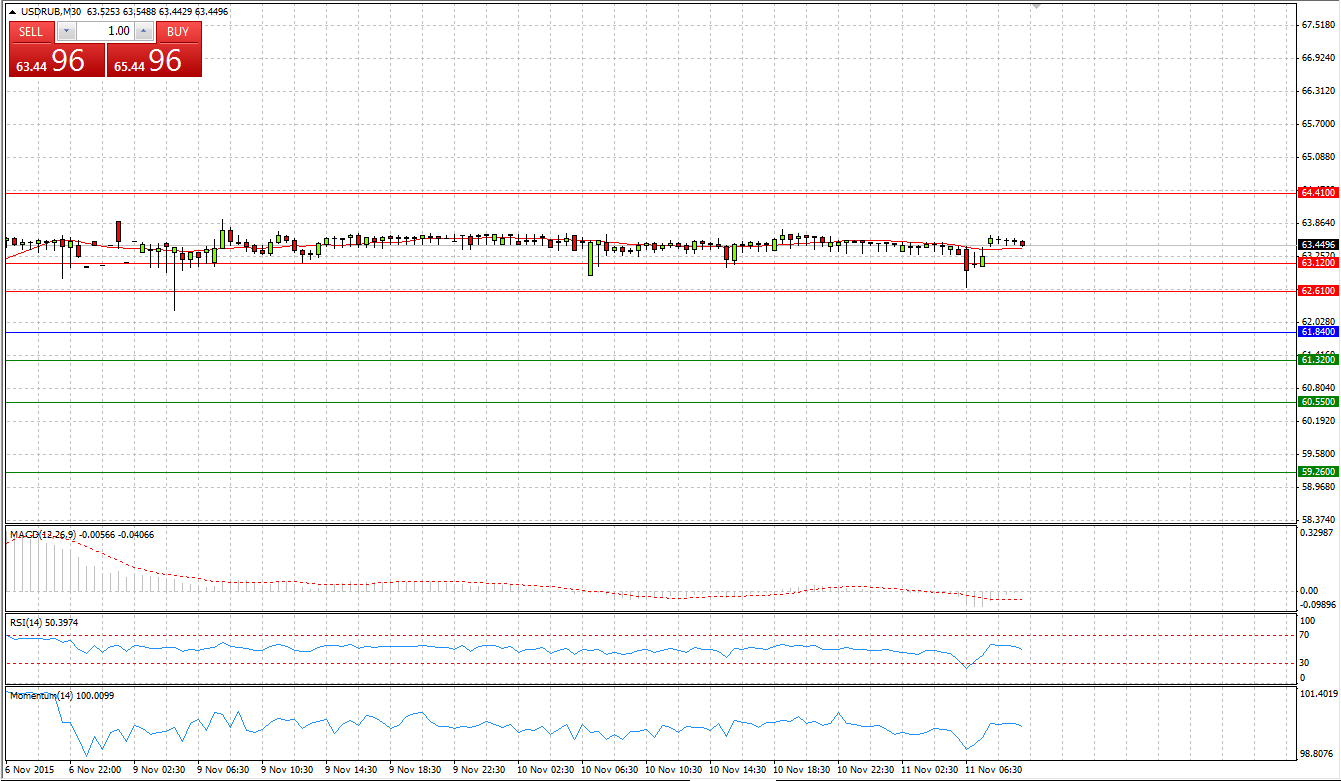
Market Scenario 1: Long positions above 63.21 with targets at 64.18 and 64.90
Market Scenario 2: Short positions below 63.21 with targets at 62.49 and 61.52
Comment: The pair is trading close to its highs. Low prices on crude oil continue to add pressure on Russian ruble stimulating bulls to undertake attempts to push the pair higher.
Supports and Resistances:
R3 66.59
R2 64.90
R1 64.18
PP 63.21
S1 62.49
S2 61.52
S3 59.83
