Higher rates may strengthen currency
New Zealand’s dollar is getting stronger on positive macroeconomic data and high base rate. The 10-year bond yields in New Zealand are one of the highest in the developed countries totaling 3.84%. In the neighbouring Australia, it is slightly below 3%. Will the New Zealand’s dollar continue gaining ground?
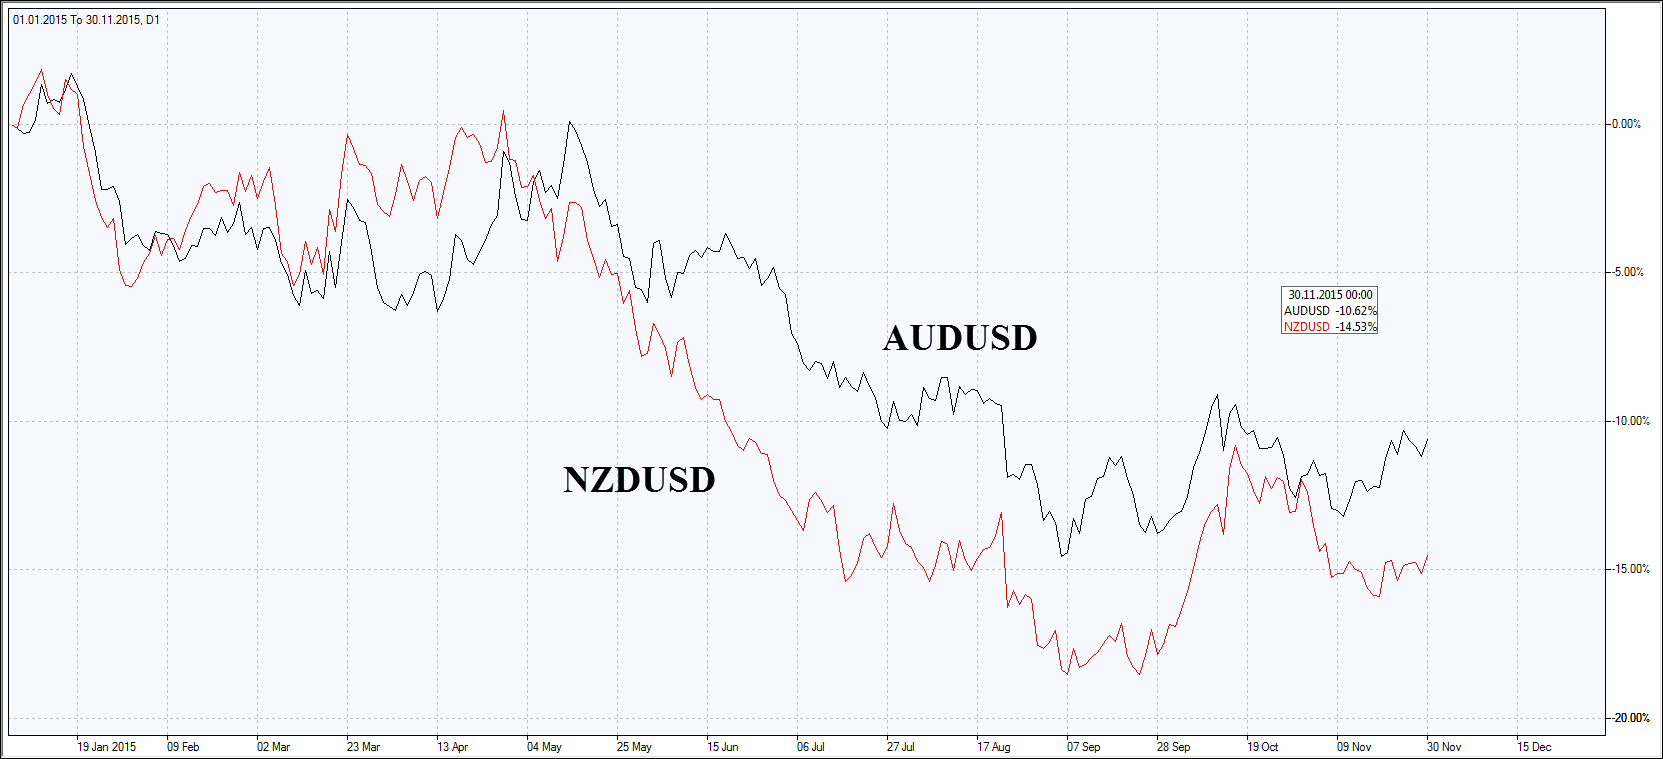
New Zealand’s November consumer confidence index came out on November 30, the reading being the highest in recent 6 months. The majority of other macroeconomic indicators remain positive as well. In particular, last week the negative trade balance for October contracted. The New Zealand’s base rate is 2.75%, Australia’s is 2%. In our opinion, the rate of the New Zealand’s dollar could have been higher but investors are concerned with the probable further interest rate cut on the Reserve Bank meeting on December 9. It may be reduced to 2.5% from the current 2.75%, according to the forecasts. This year, the New Zealand’s Central Bank has already cut the rate three times by 0.25 percentage points each. At the start of the year, the rate was 3.5%. The current New Zealand’s dollar uptrend may continue till the Central Bank meeting. Its further dynamics will depend on the Banks decision on the rate. Note, that this year the Reserve Bank of Australia cut the rate only twice by the same 0.25 percentage points. Since April, it remains on the current 2% level down from 2.5% early in the year. Australia’s GDP advanced 2% in the 2nd quarter while New Zealand’s edged 2.4% up. Meanwhile, the Aussie lost only 10% against the US dollar since the start of the year, while the New Zealand dollar fell almost 15%.


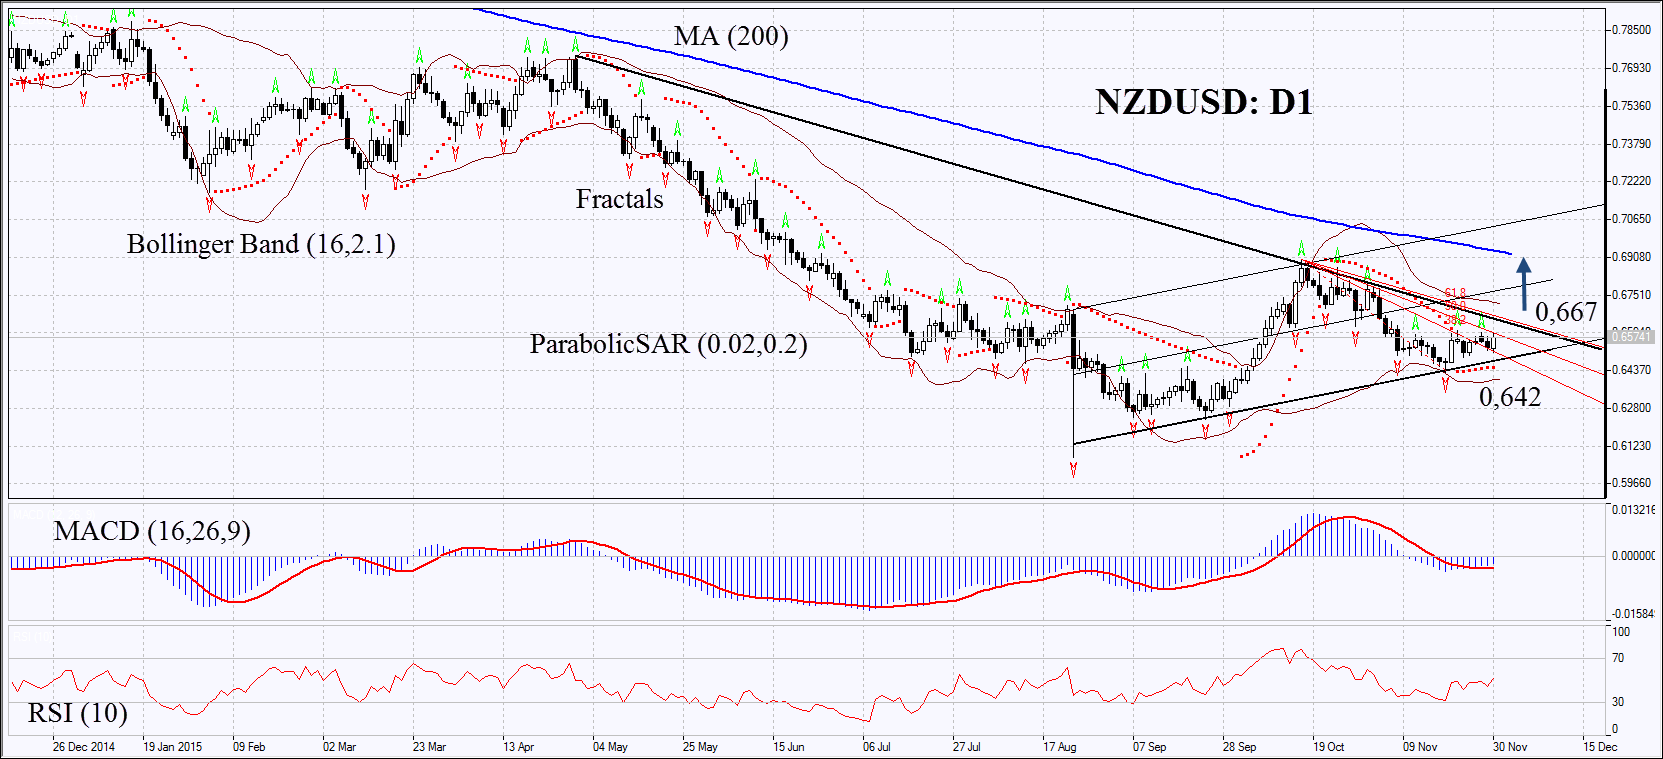
On the daily chart, the NZDUSD: D1 is in uptrend. Parabolic indicator and MACD have formed the buy signals. RSI is neutral near 50, no divergence. The Bollinger bands® have contracted, which may mean low volatility. The bullish trend may develop in case New Zealand’s dollar surpasses the three last fractal highs and the Fibonacci Fan line at 0.667. This level may serve the point of entry. The initial risk-limit may be placed below the Parabolic signal and the last fractal low at 0.642. Having opened the pending order, we shall move the stop to the next fractal low following the Parabolic and Bollinger signals. Thus, we are changing the probable profit/loss ratio to the breakeven point. The most risk-averse traders may switch to the 4-hour chart after the trade and place there a stop-loss moving it in the direction of the trade. If the price meets the stop-loss level at 0.642 without reaching the order at 0.667, we recommend cancelling the position: the market sustains internal changes which were not taken into account.
Position Buy Buy stop above 0,667 Stop loss below 0,642
