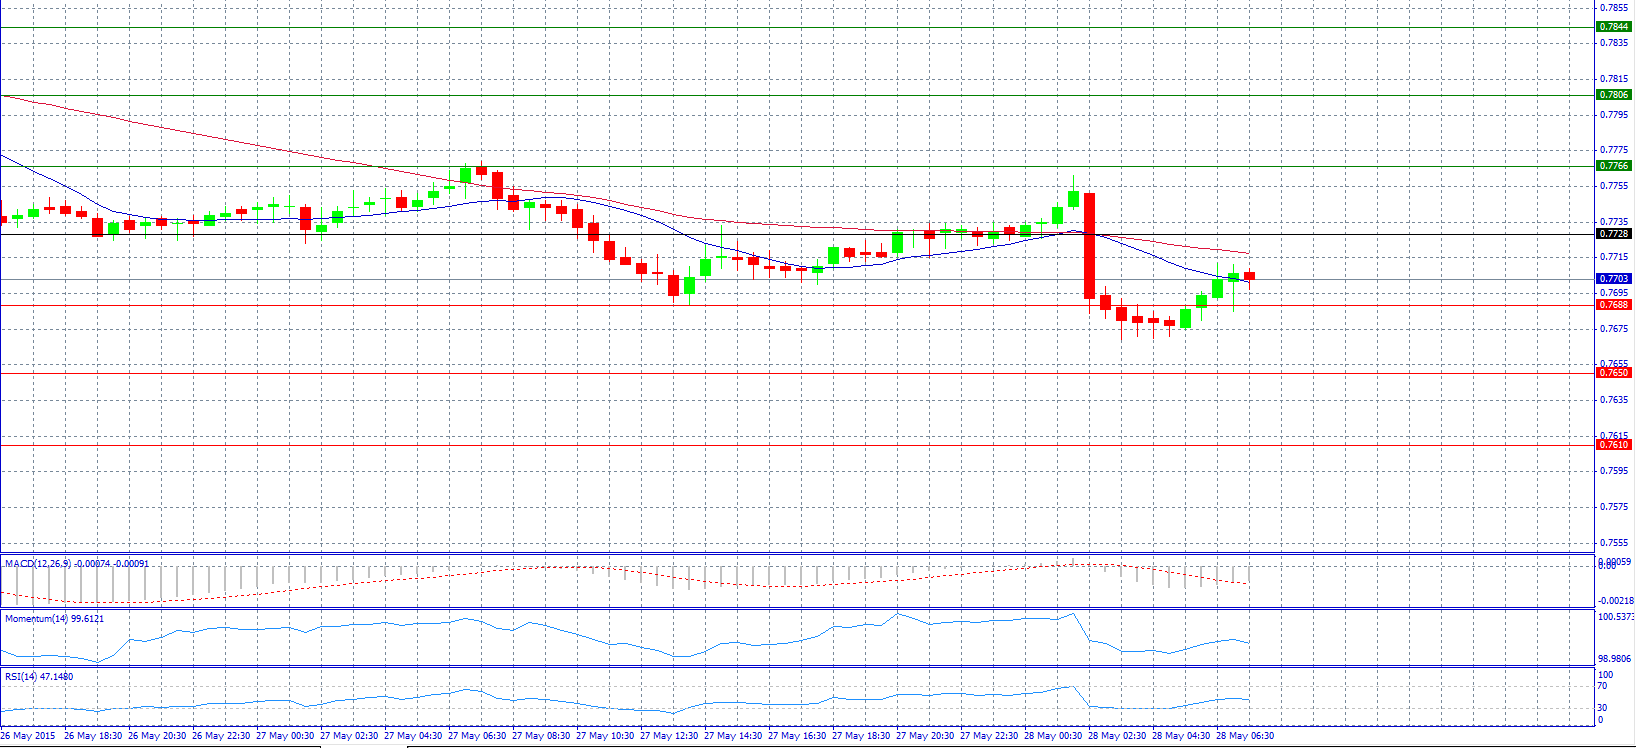
Market Scenario 1: Long positions above 0.7728 with target at 0.7766.
Market Scenario 2: Short positions below 0.7688 with target at 0.7650.
Comment: The pair recovers above 0.7700 level.
Supports and Resistances:
R3 0.7844
R2 0.7806
R1 0.7766
PP 0.7728
S1 0.7688
S2 0.7650
S3 0.7610
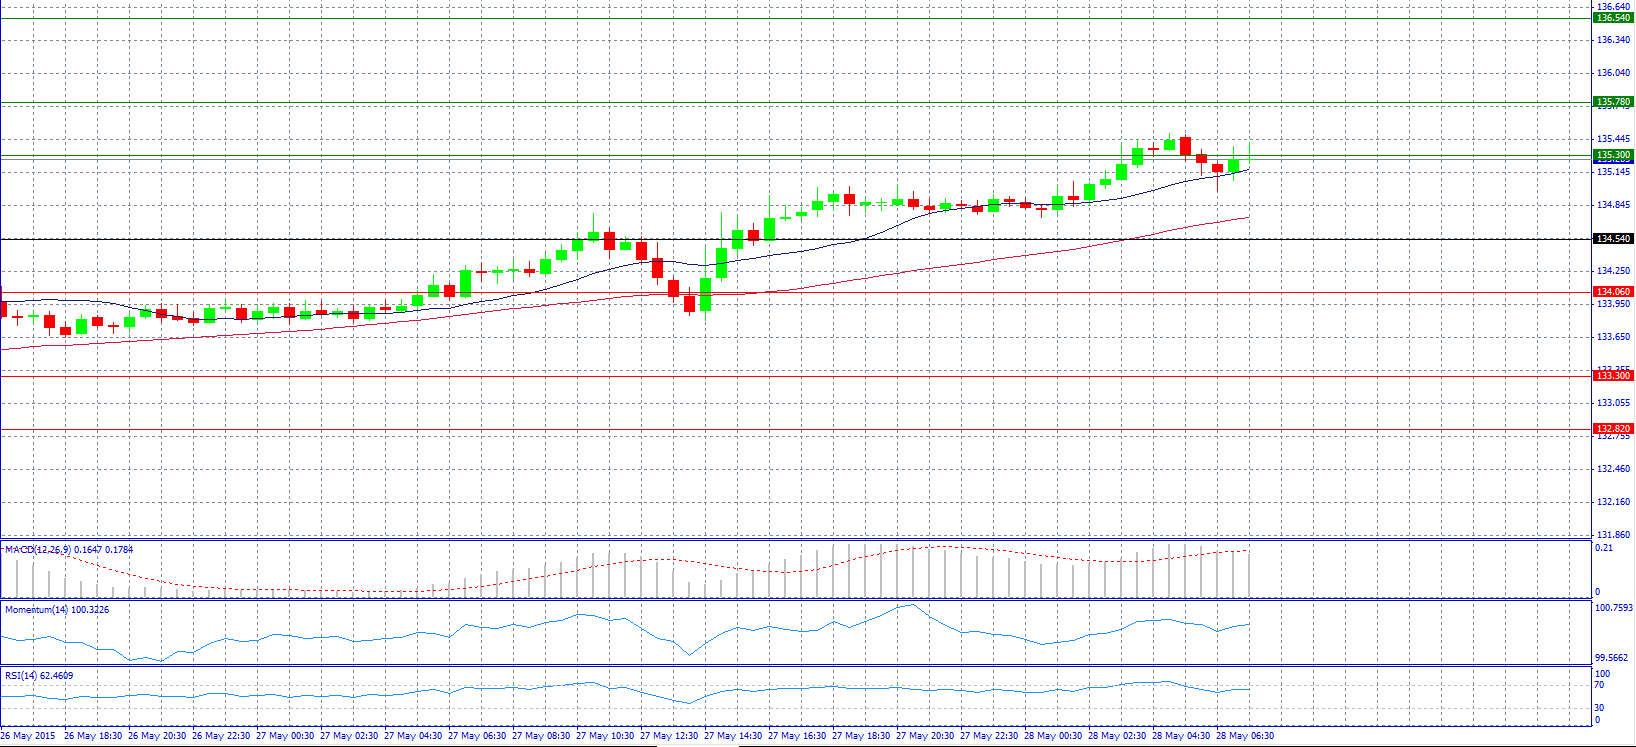
Market Scenario 1: Long positions above 135.30 with target at 135.78.
Market Scenario 2: Short positions below 135.30 with target at 134.54.
Comment: The pair advanced and makes attempts to break resistance level 135.30.
Supports and Resistances:
R3 136.54
R2 135.78
R1 135.30
PP 134.54
S1 134.06
S2 133.30
S3 132.82
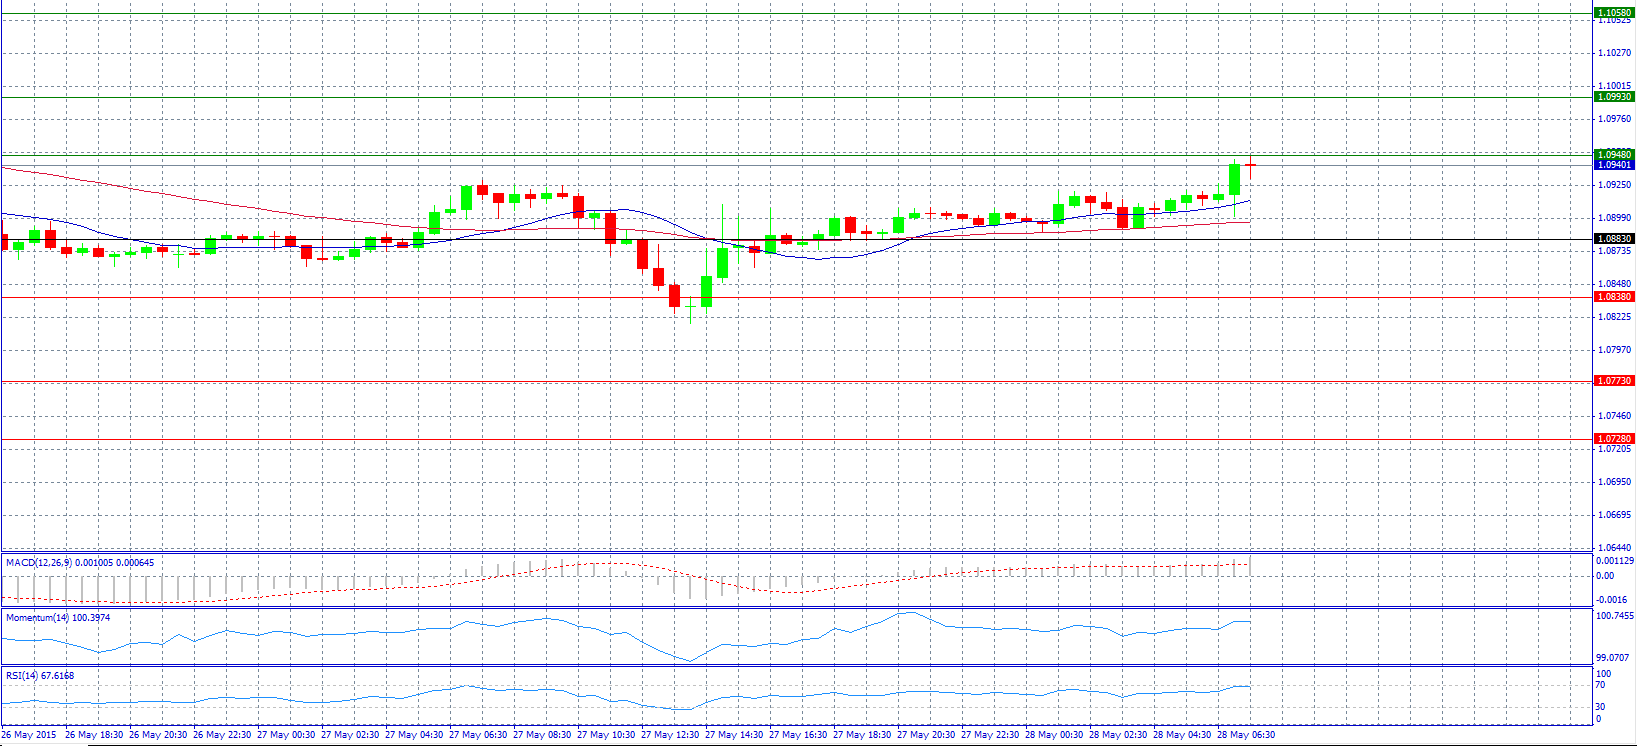
Market Scenario 1: Long positions above 1.0948 with target at 1.0993.
Market Scenario 2: Short positions below 1.0948 with target at 1.0883.
Comment: The pair rose near 1.0940 level.
Supports and Resistances:
R3 1.1058
R2 1.0993
R1 1.0948
PP 1.0883
S1 1.0838
S2 1.0773
S3 1.0728
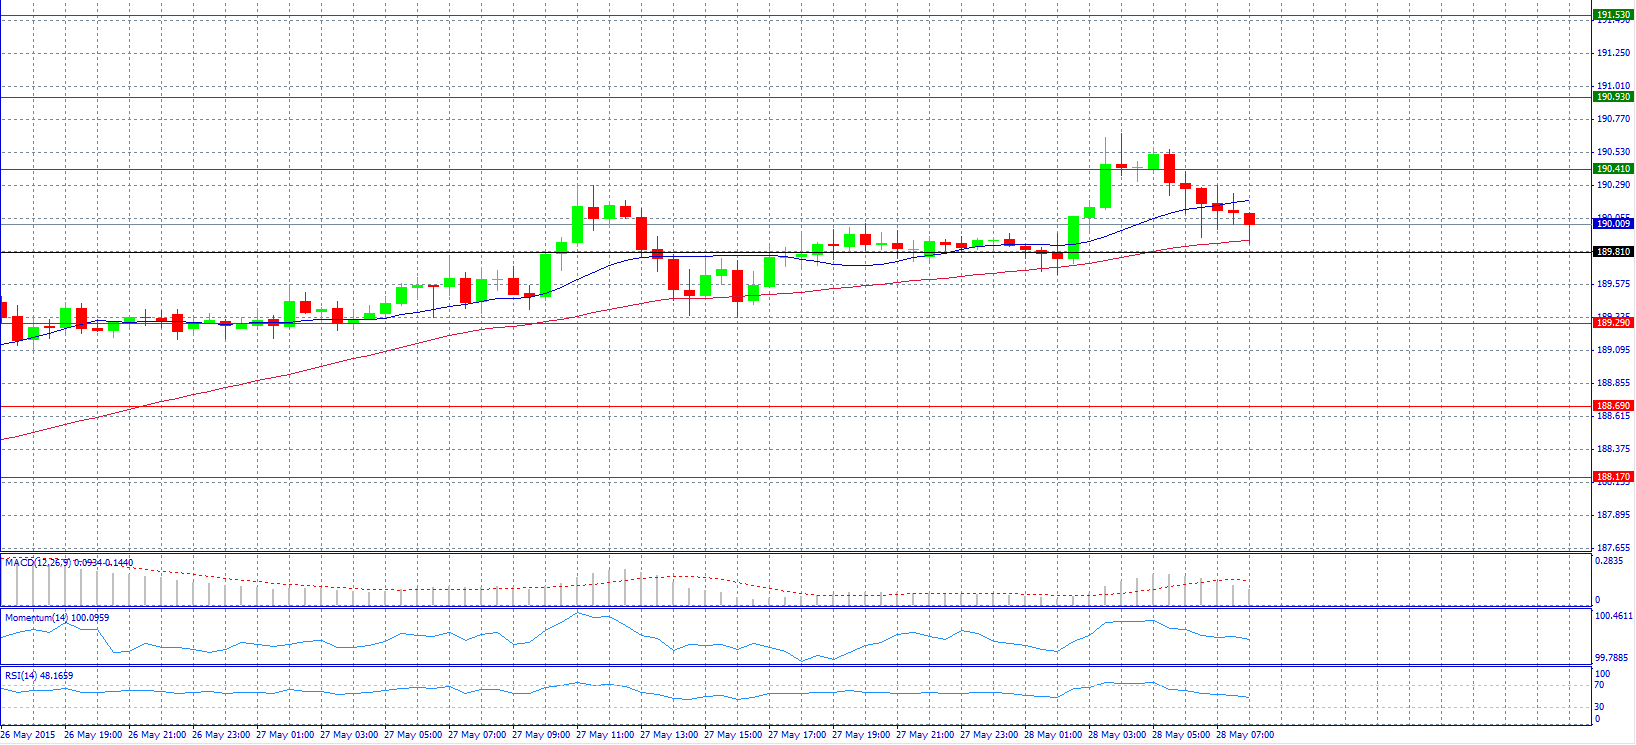
Market Scenario 1: Long positions above 190.41 with target at 190.93.
Market Scenario 2: Short positions below 189.81 with target at 189.29.
Comment: The pair weakened and dropped to 190.00 level.
Supports and Resistances:
R3 191.53
R2 190.93
R1 190.41
PP 189.81
S1 189.29
S2 188.69
S3 188.17
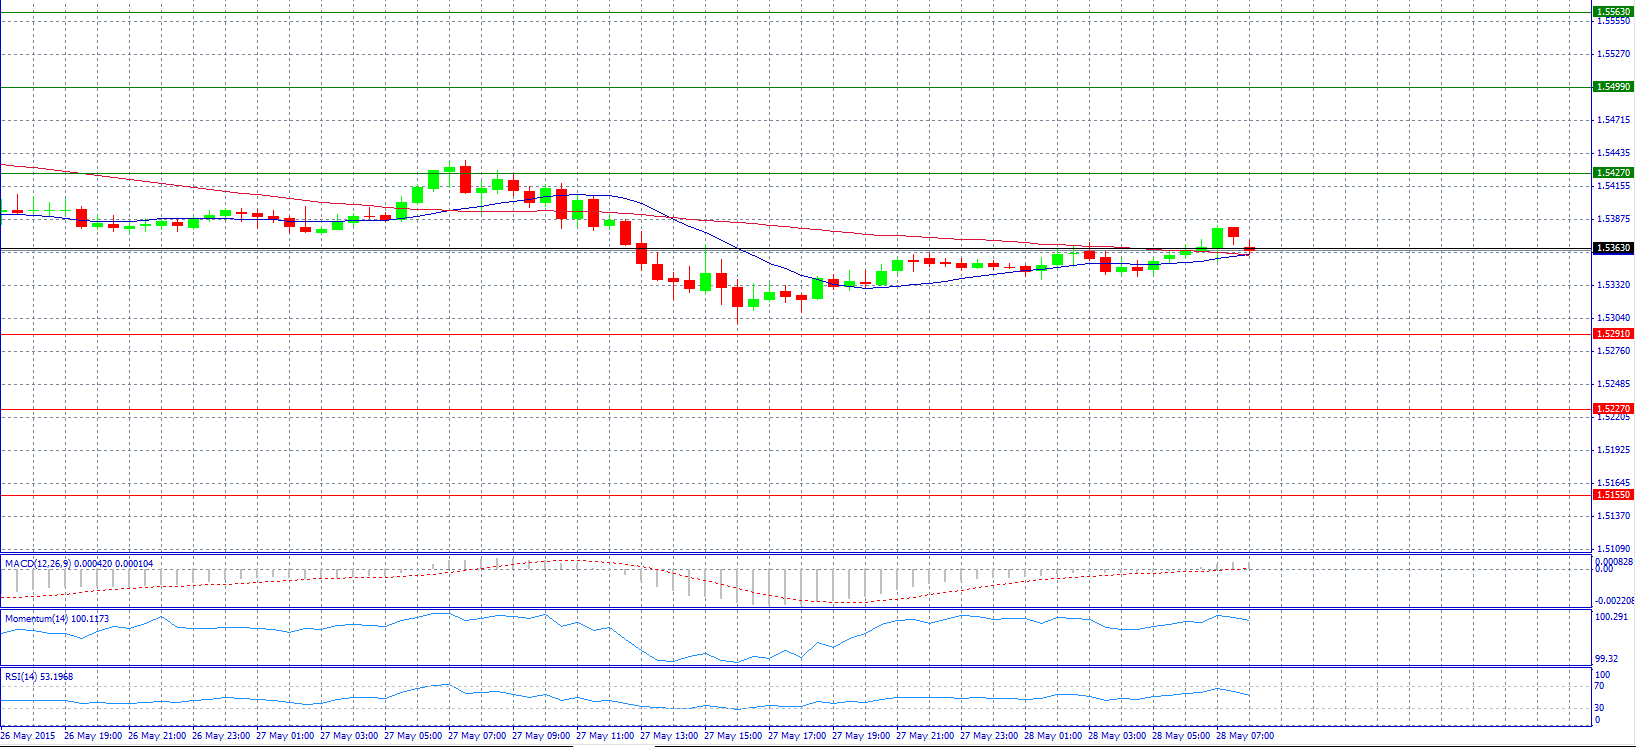
Market Scenario 1: Long positions above 1.5363 with target at 1.5427.
Market Scenario 2: Short positions below 1.5363 with target at 1.5291.
Comment: The pair tried several times to surpass pivot point 1.5363 and stay above it, but failed.
Supports and Resistances:
R3 1.5563
R2 1.5499
R1 1.5427
PP 1.5363
S1 1.5291
S2 1.5227
S3 1.5155
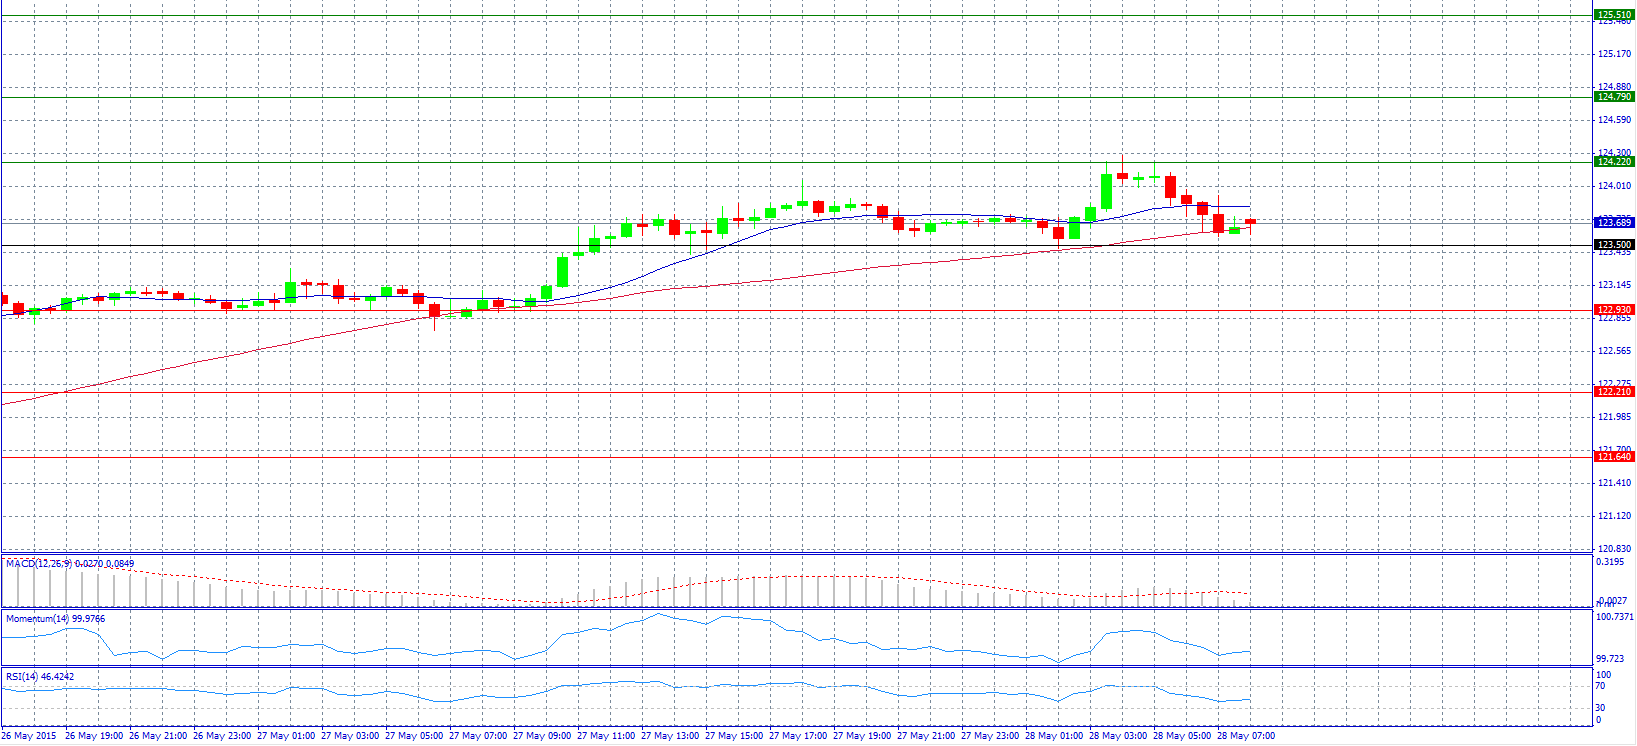
Market Scenario 1: Long positions above 124.22 with target at 124.79.
Market Scenario 2: Short positions below 123.50 with target at 122.93.
Comment: The pair rejected 124.30 and fell near to 123.70.
Supports and Resistances:
R3 125.51
R2 124.79
R1 124.22
PP 123.50
S1 122.93
S2 122.21
S3 121.64
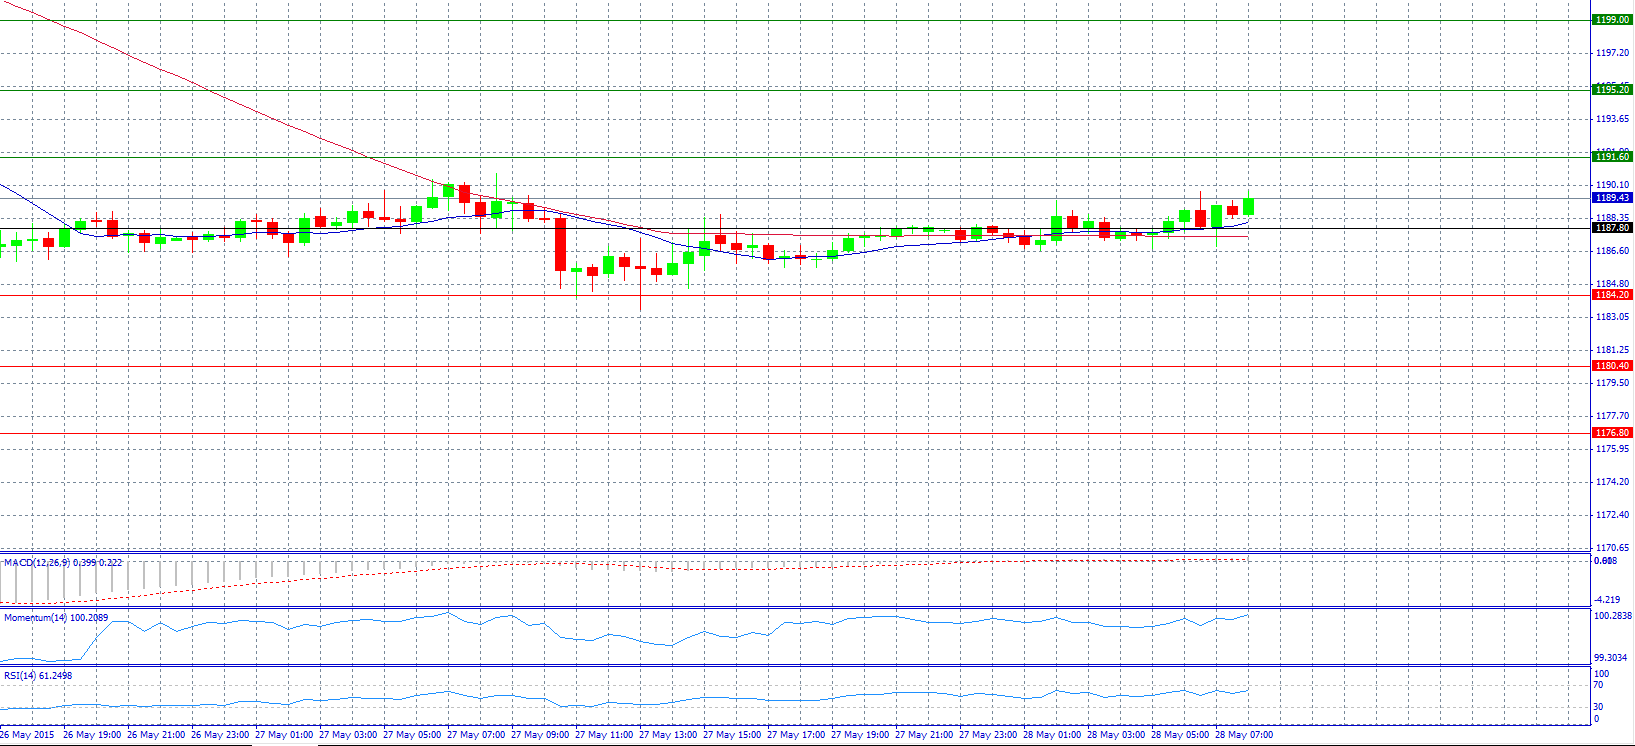
Market Scenario 1: Long positions above 1191.60 with target at 1195.20.
Market Scenario 2: Short positions below 1187.80 with target at 1184.20.
Comment: Gold prices trade steady, but still remain near 2-week low.
Supports and Resistances:
R3 1199.00
R2 1195.20
R1 1191.60
PP 1187.80
S1 1184.20
S2 1180.40
S3 1176.80
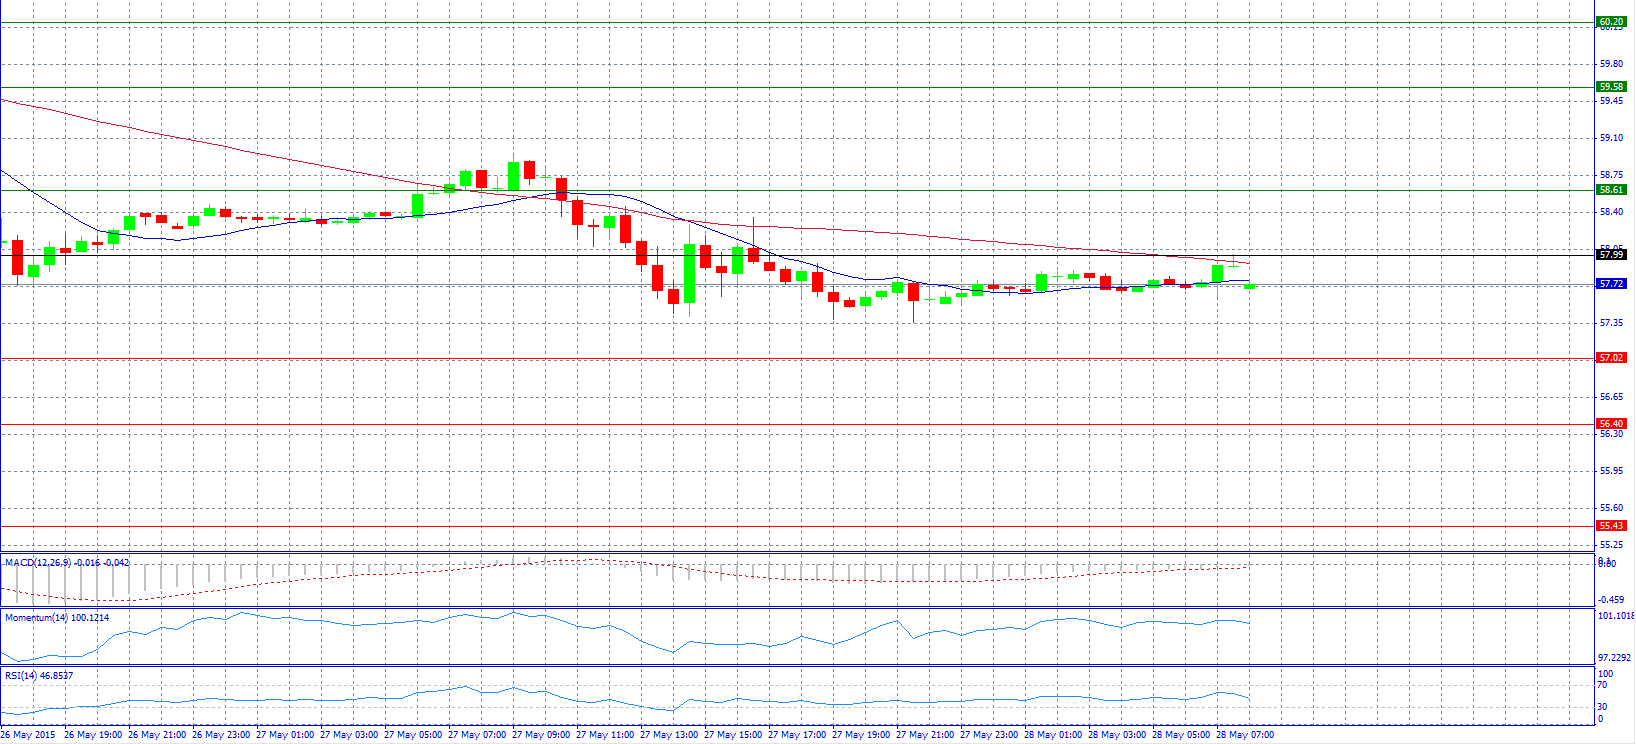
Market Scenario 1: Long positions above 57.99 with target at 58.61.
Market Scenario 2: Short positions below 57.99 with target at 57.02.
Comment: Crude oil prices broke downward after spending much of May in consolidation mode.
Supports and Resistances:
R3 60.20
R2 59.58
R1 58.61
PP 57.99
S1 57.02
S2 56.40
S3 55.43
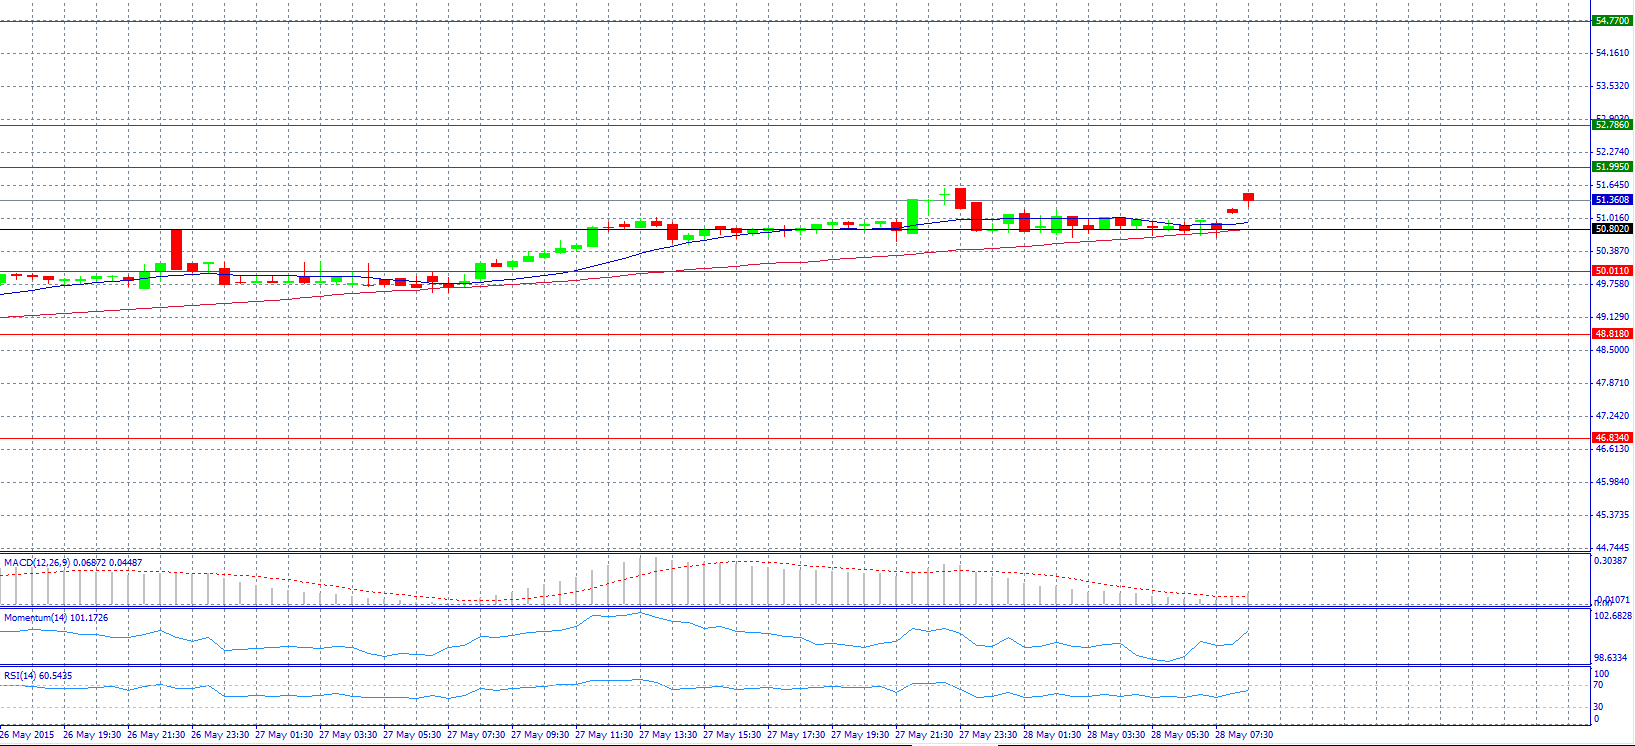
Market Scenario 1: Long positions above 51.995 with target at 52.786.
Market Scenario 2: Short positions below 50.802 with target at 50.011.
Comment: The pair rose slightly above 51.300 level.
Supports and Resistances:
R3 54.770
R2 52.786
R1 51.995
PP 50.802
S1 50.011
S2 48.818
S3 46.834
