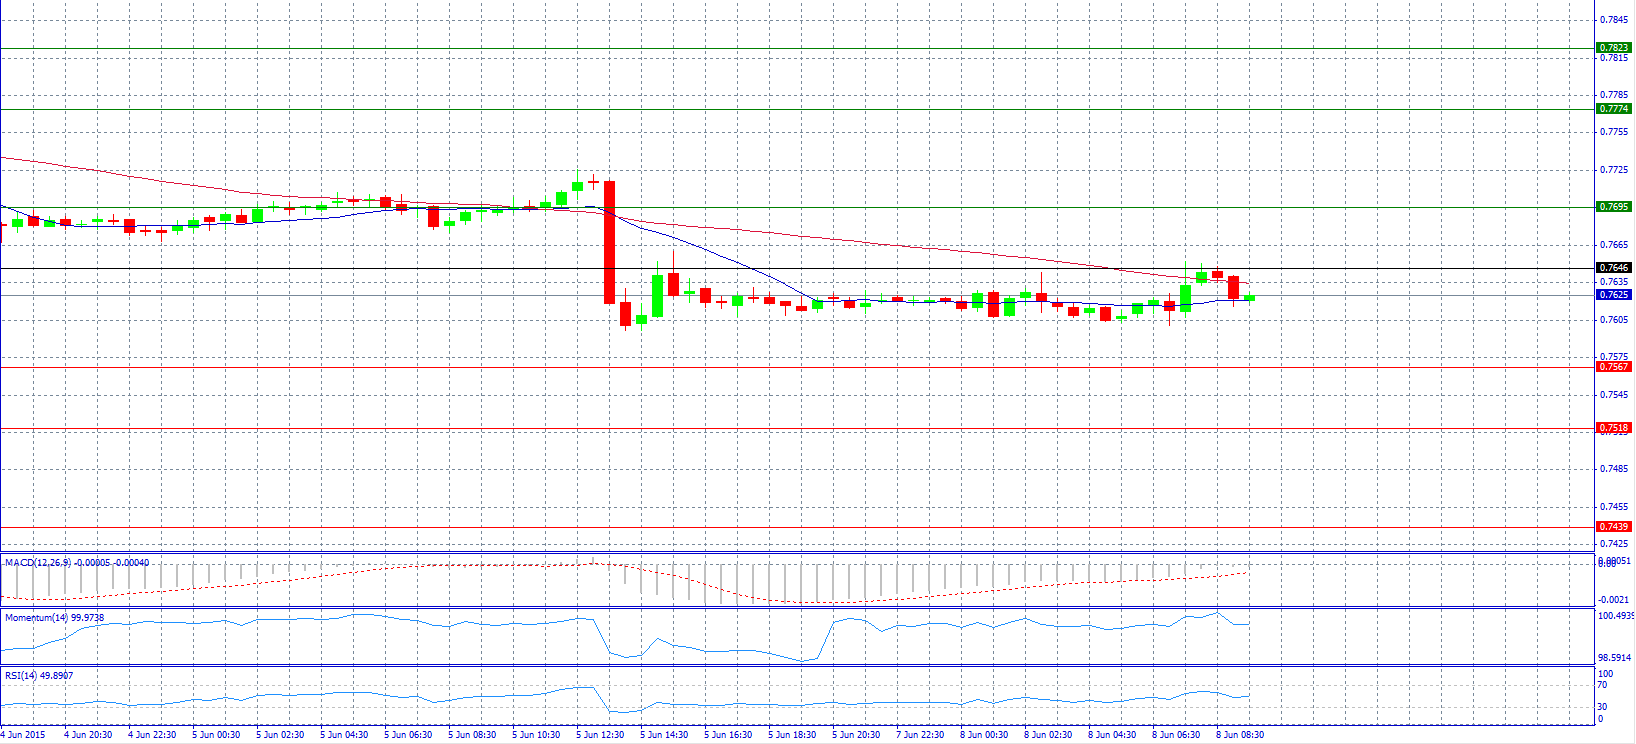
Market Scenario 1: Long positions above 0.7646 with target at 0.7695.
Market Scenario 2: Short positions below 0.7646 with target at 0.7567.
Comment: The pair trades quiet below pivot point 0.7646.
Supports and Resistances:
R3 0.7823
R2 0.7774
R1 0.7695
PP 0.7646
S1 0.7567
S2 0.7518
S3 0.7439
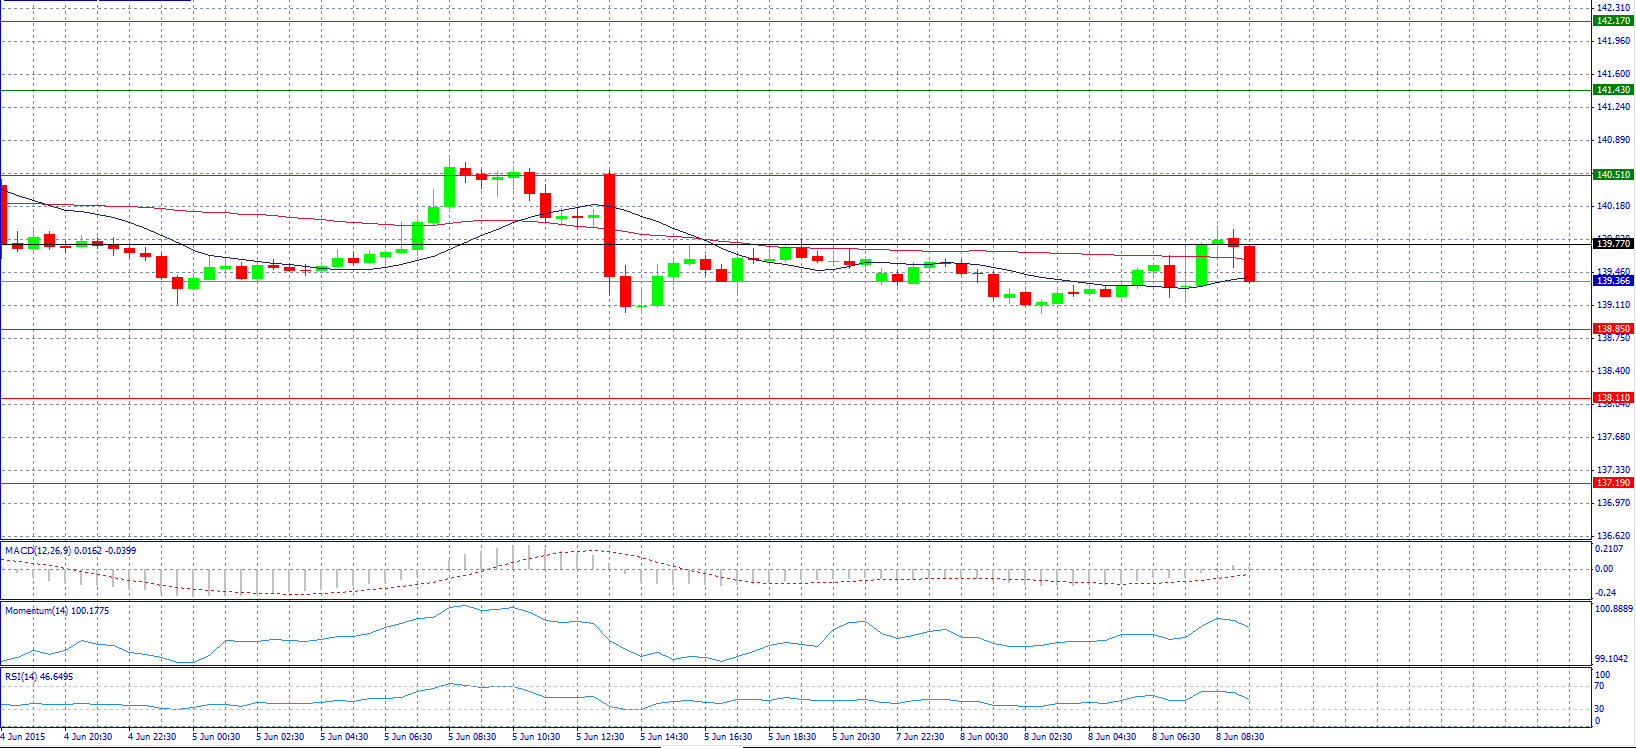
Market Scenario 1: Long positions above 139.77 with target at 140.51.
Market Scenario 2: Short positions below 139.77 with target at 138.85.
Comment: The pair advanced and tried to break pivot point 139.77 but retraced.
Supports and Resistances:
R3 142.17
R2 141.43
R1 140.51
PP 139.77
S1 138.85
S2 138.11
S3 137.19
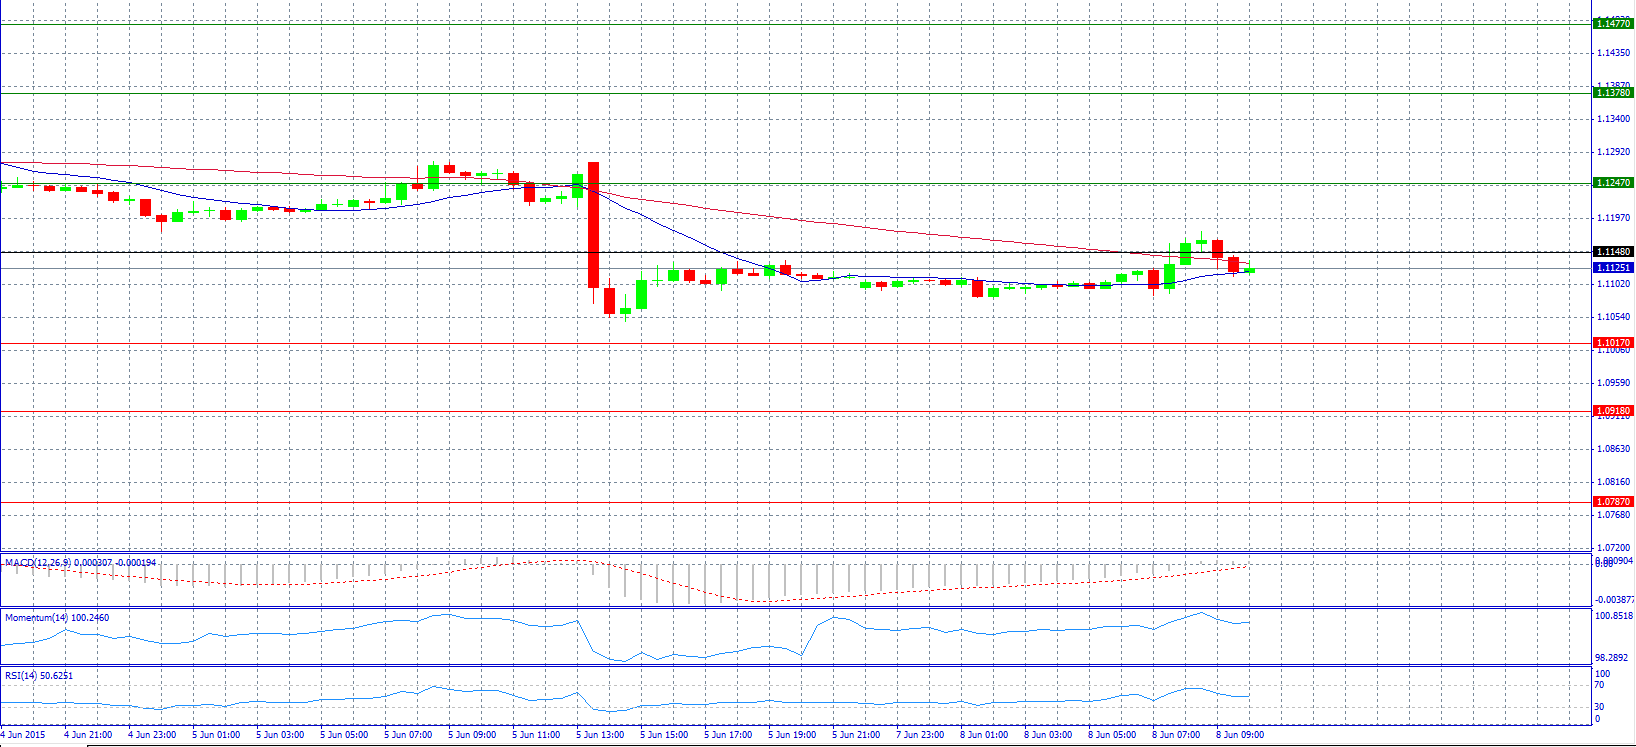
Market Scenario 1: Long positions above 1.1148 with target at 1.1247.
Market Scenario 2: Short positions below 1.1148 with target at 1.1017.
Comment: The pair dropped to 1.1120 level because the single currency has deflated from session tops today.
Supports and Resistances:
R3 1.1477
R2 1.1378
R1 1.1247
PP 1.1148
S1 1.1017
S2 1.0918
S3 1.0787
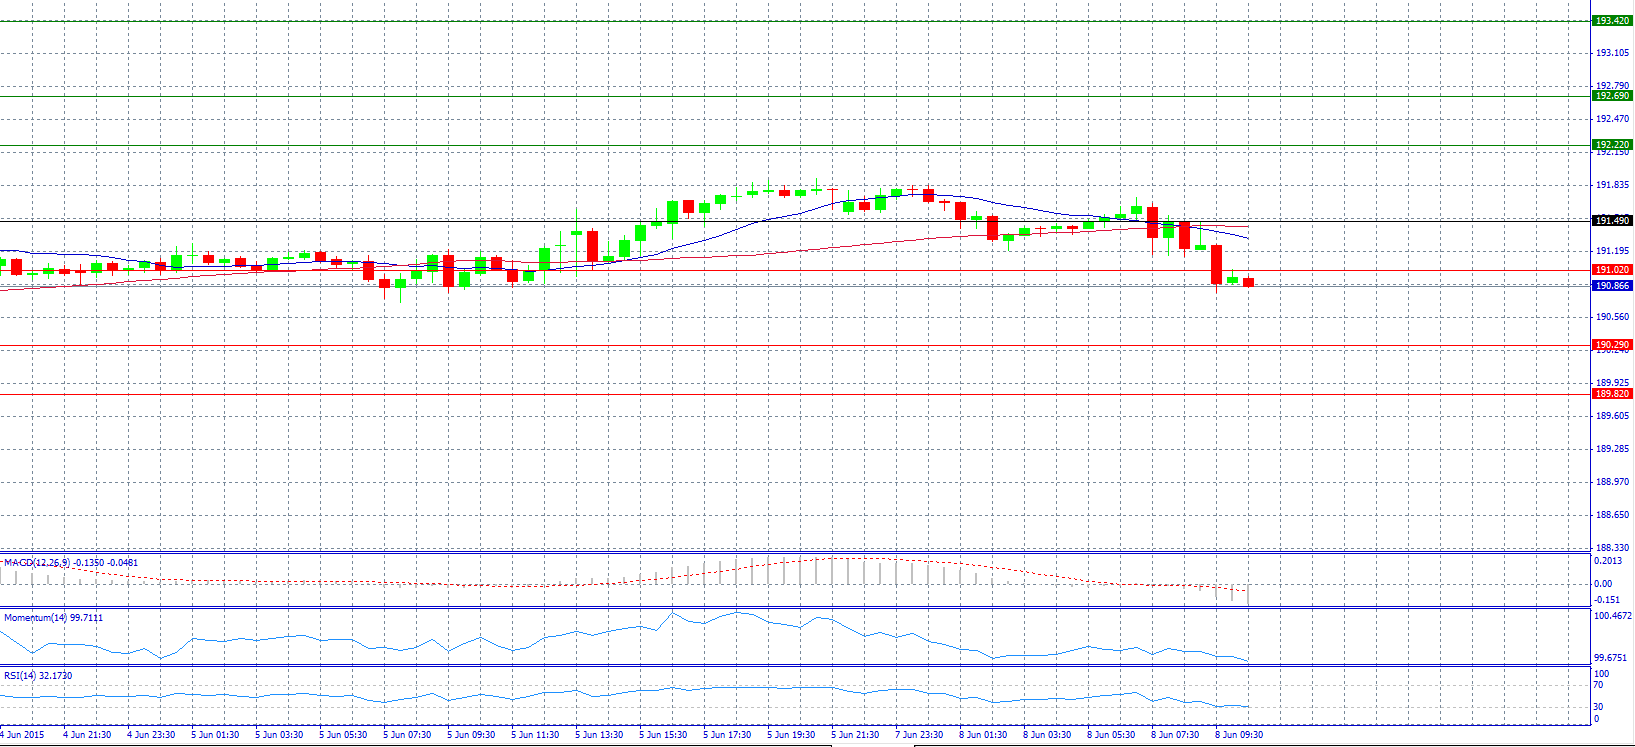
Market Scenario 1: Long positions above 191.02 with target at 191.49.
Market Scenario 2: Short positions below 191.02 with target at 190.29.
Comment: The pair after the big profits it made by reaching a 7-year high, retraced and broke support level 191.02.
Supports and Resistances:
R3 193.42
R2 192.69
R1 192.22
PP 191.49
S1 191.02
S2 190.29
S3 189.82
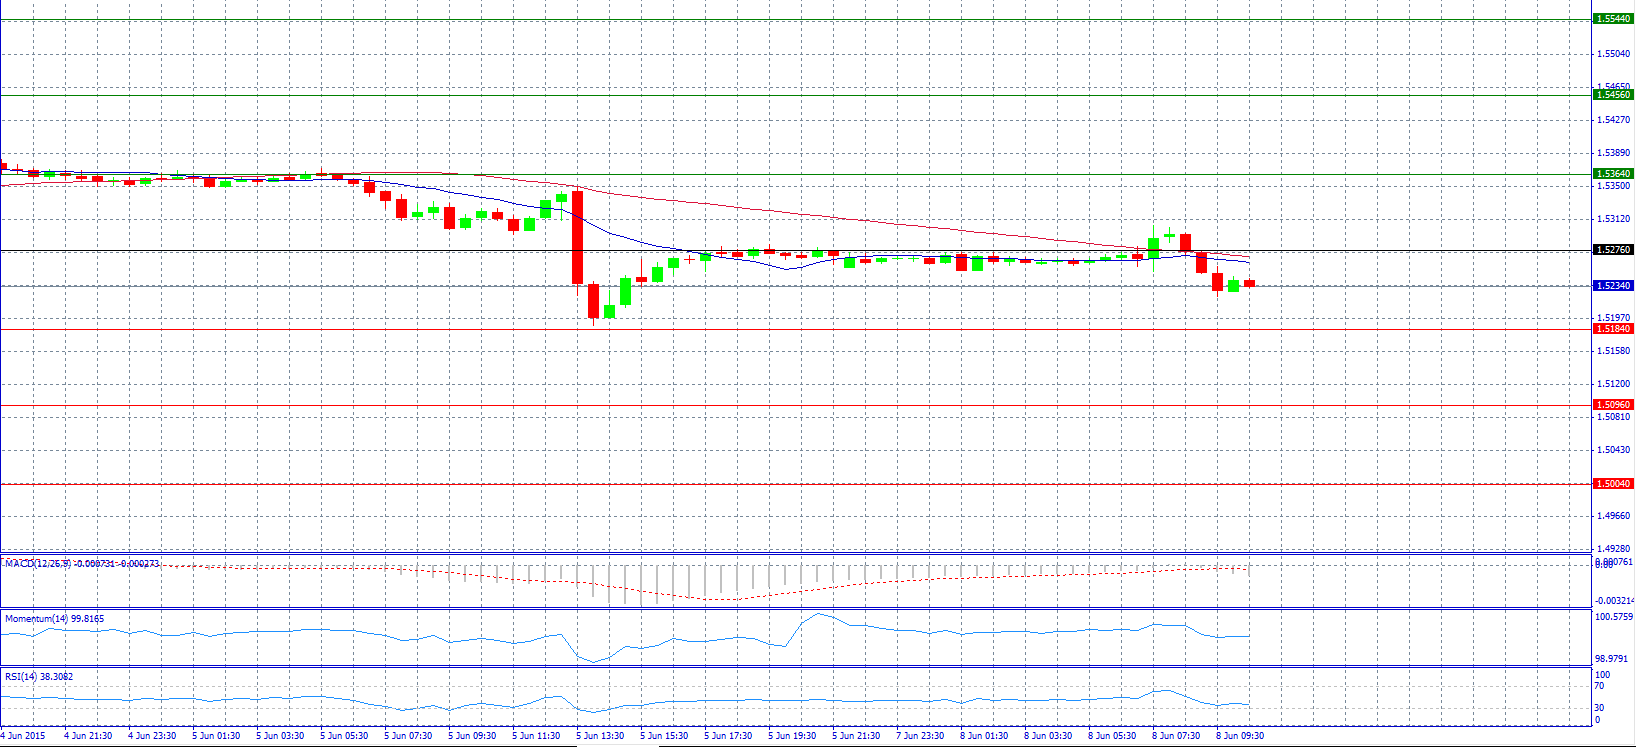
Market Scenario 1: Long positions above 1.5276 with target at 1.5364.
Market Scenario 2: Short positions below 1.5184 with target at 1.5096.
Comment: The pair sees scope for further recovery towards 1.6000 level, according to analysts.
Supports and Resistances:
R3 1.5544
R2 1.5456
R1 1.5364
PP 1.5276
S1 1.5184
S2 1.5096
S3 1.5004
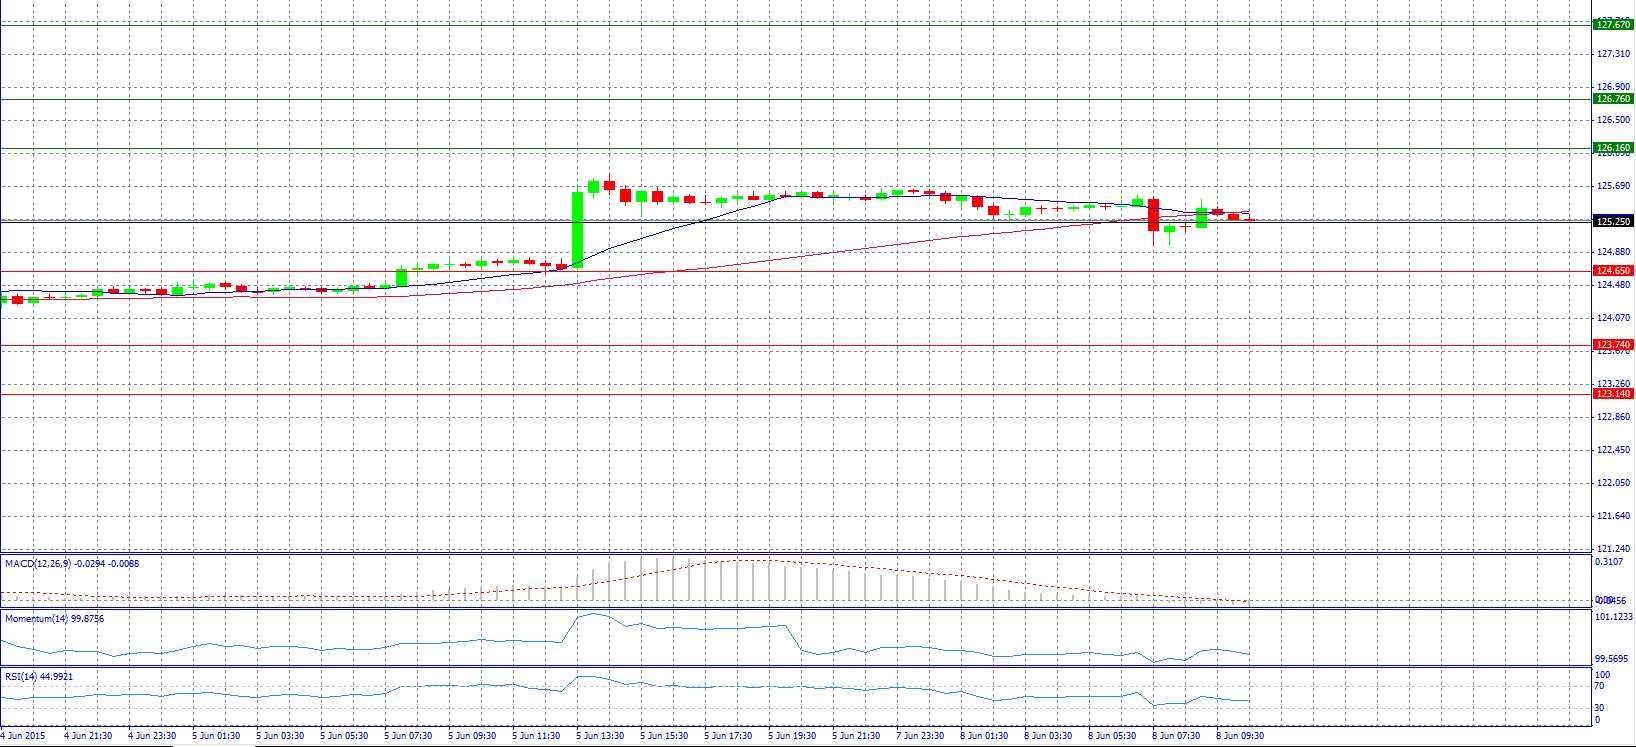
Market Scenario 1: Long positions above 125.25 with target at 126.16.
Market Scenario 2: Short positions below 125.25 with target at 124.65.
Comment: The pair pared losses as the US dollar recovered lost ground versus its major counterparts, after an US official rubbished the rumors and noted that President ‘Obama didn't say strong dollar was a problem.’
Supports and Resistances:
R3 127.67
R2 126.76
R1 126.16
PP 125.25
S1 124.65
S2 123.74
S3 123.14
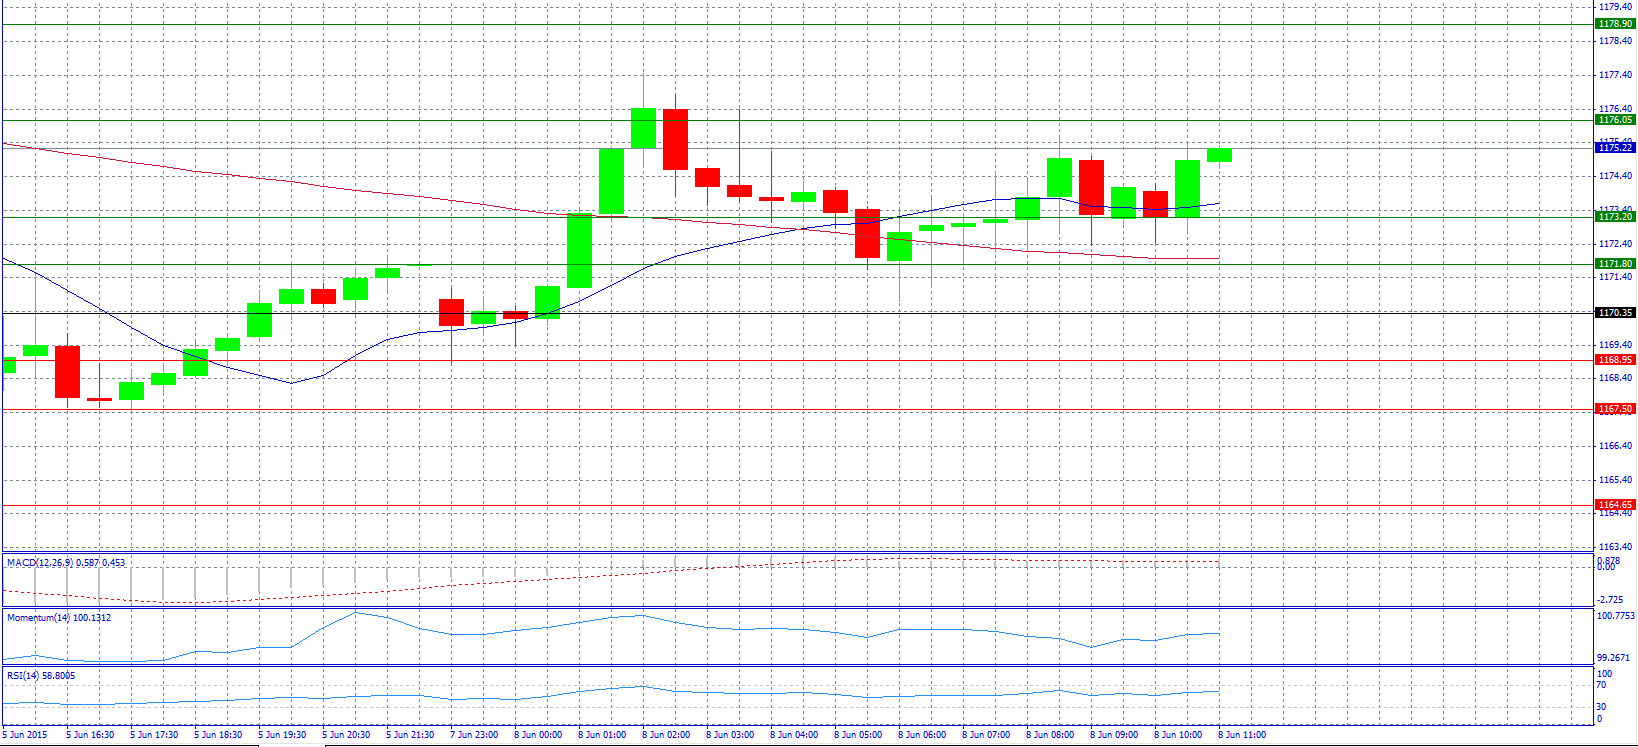
Market Scenario 1: Long positions above 1176.05 with target at 1178.90.
Market Scenario 2: Short positions below 1173.20 with target at 1171.80.
Comment: Gold prices trade steady following Friday sell-off, platinum off lows.
Supports and Resistances:
R4 1178.90
R3 1176.05
R2 1173.20
R1 1171.80
PP 1170.35
S1 1168.95
S2 1167.50
S3 1164.65
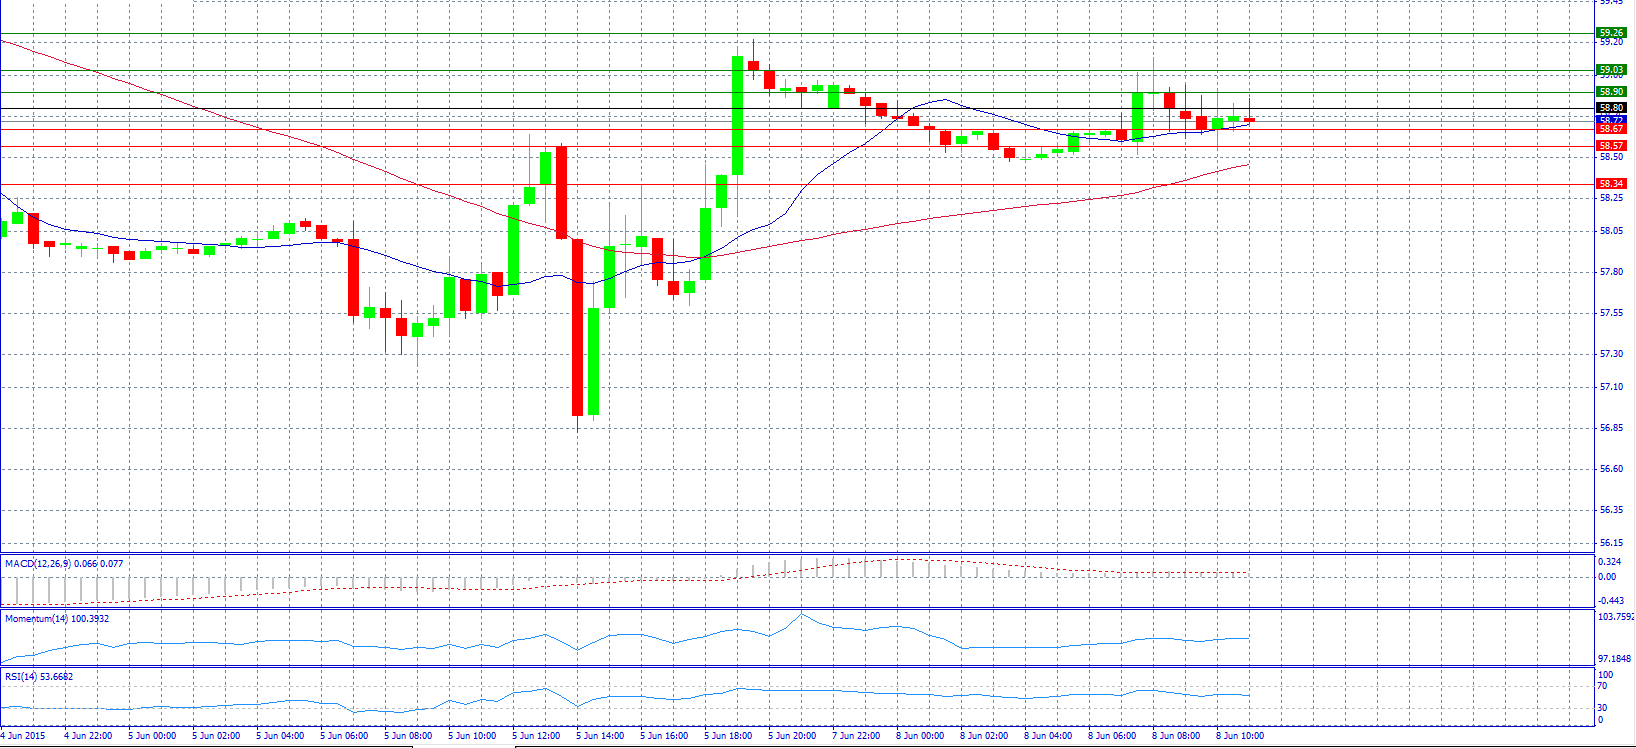
Market Scenario 1: Long positions above 58.80 with target at 58.90.
Market Scenario 2: Short positions below 58.67 with target at 58.57.
Comment: Crude oil prices trade neutral below pivot point 58.80.
Supports and Resistances:
R3 59.26
R2 59.03
R1 58.90
PP 58.80
S1 58.67
S2 58.57
S3 58.34
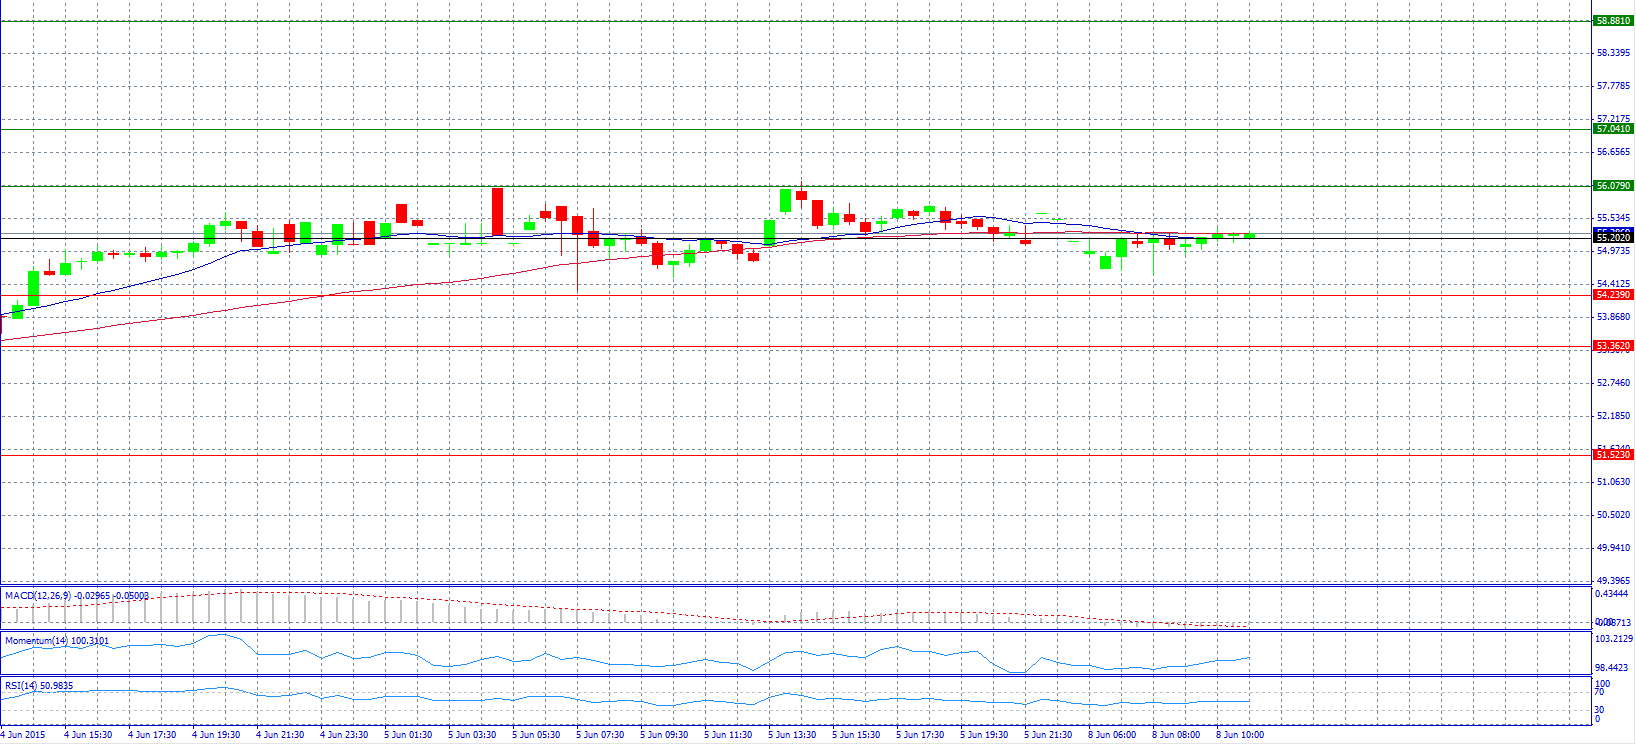
Market Scenario 1: Long positions above 55.202 with target at 56.079.
Market Scenario 2: Short positions below 55.202 with target at 54.239.
Comment: The pair trades unchanged above pivot point 55.202.
Supports and Resistances:
R3 58.881
R2 57.041
R1 56.079
PP 55.202
S1 54.239
S2 53.362
S3 51.523
