Greece again has difficulties ahead of IMF fundings
IMF has not yet come to the single opinion on further financial help to Greece. On this news the yields of the 2-year bonds has reached 7-month high of 10% a year. The crisis in Greece raises the financial risks for the whole Eurozone. Will euro edge lower?
IMF has not yet decided on the budget surplus that Greece is to ensure till 2018. The fund considers the range of 1.5%-3.5%. This obliges Greece to continue the unpopular reforms and to cut the social support of the Greek people. As the Greek GDP is not to surpass the level of 1% in mid-term range, according to IMF, the budget surplus shall be ensured by means of austerity measures. Greece reckons on getting the 3rd IMF tranche of 86bn euros in Q3 2017 to restructure the previous debts. The total public debt of Greece will reach 180% of GDP.
Given the heightened economic risks, EUR/USD pair showed on Tuesday a record decline in 2017. The additional negative came from Marine Le Pen, the “National front” candidate for presidential elections in France. She introduced her political program where considered it necessary to hold a referendum for France to leave the EU. BVA Agency estimated her chances to win the presidential elections at 25%.
The unexpectedly weak manufacturing production data for December came out in Germany on Tuesday. It fell 3% compared to November which is the record decline in 8 years. Nevertheless, the negative data did not have major impact on the markets as most investors considered it accidental and expect the German industrial production to rise in January.

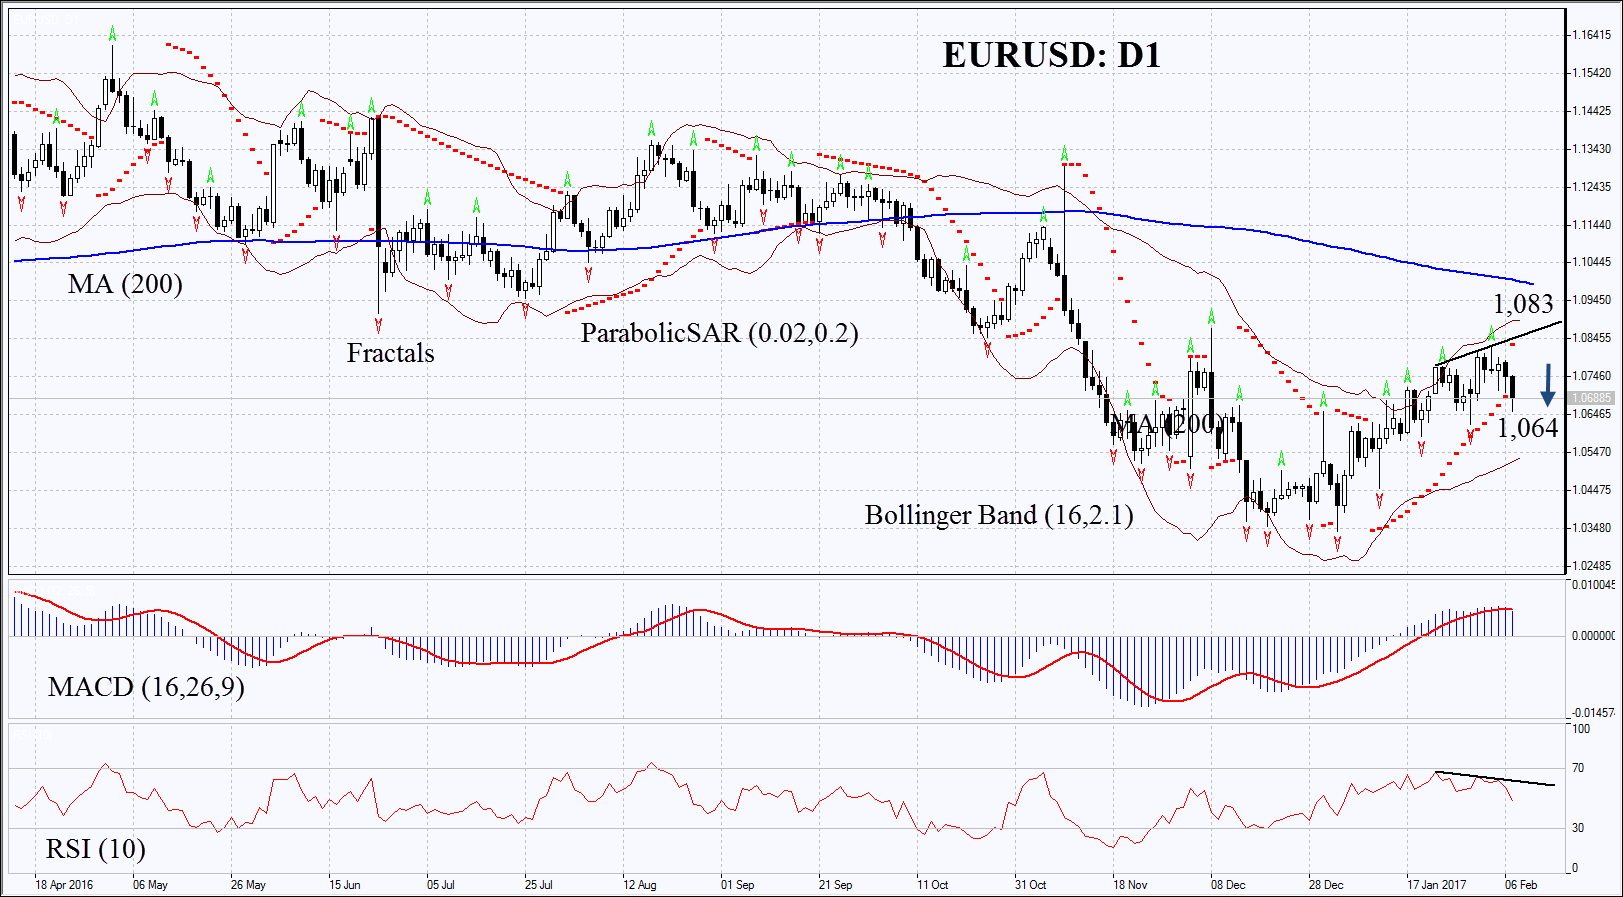
On the daily chart EUR/USD: D1has edged lower within the rising trend. Its further decline is possible in case the negative economic data come out in Eurozone and Germany and in case of further negative developments in Greece and France.
- The Parabolic indicator gives bearish signals.
- The Bollinger bands have widened which means higher volatility.
- The RSI iis below 50, it has formed negative divergence.
- The MACD is giving bearish signals.
The bearish momentum may develop in case EUR/USD falls below the last fractal low at 1.064. This level may serve the point of entry. The initial stop-loss may be placed above the Parabolic signal and the last fractal high at 1.083. Having opened the pending order we shall move the stop to the next fractal high following the Parabolic and Bollinger signals. Thus, we are changing the probable profit/loss ratio to the breakeven point.
The most risk-averse traders may switch to the 4-hour chart after the trade and place there a stop-loss moving it in the direction of the trade. If the price meets the stop-loss level at 1.083 without reaching the order at 1.064, we recommend cancelling the position: the market sustains internal changes which were not taken into account.
Summary of technical analysis:
Position: Sell
Sell stop: Below 1.064
Stop loss: Above 1.083
