Reduced crop acres
USDA has lowered its outlook for crop acres of all kinds of wheat in the US in 2016/17 and toughened the requirements to GM wheat control. Will the prices continue increasing?
Since January 1, 2016, the US farmers will have to obtain the permission for sowing GM wheat while there was only notification requirement since 1997. USDA expects the US wheat crop acres to total 53mln acres, down from 54.6mln acres in 2014/15. The harvest may amount to 2.06bn bushels. Due to the drought, India has cut the volume of winter wheat sowing by 9.1% to 44.23mln ha, compared to the last year.

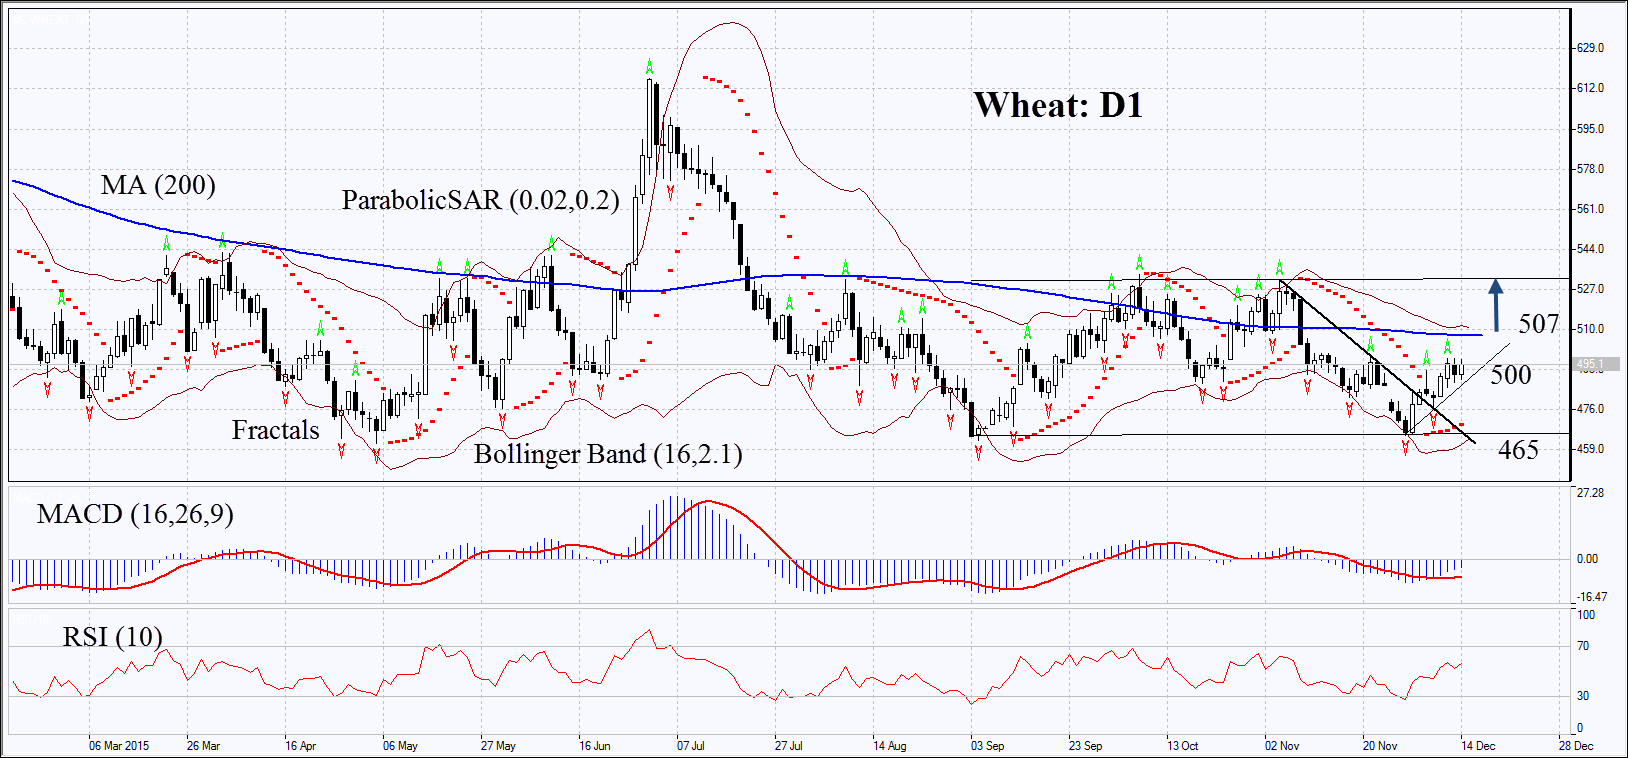
On the daily chart, Wheat: D1 is edging up having rebounded from the lower boundary of the sideways channel. The Parabolic and MACD have formed the buy signals. The Bollinger® bands have contracted which may mean lower volatility. RSI has surpassed the level of 50 but has not yet reached the overbought zone. The bullish momentum may develop in case the wheat surpasses the three fractal highs at 500. The most risk-averse traders may wait for the break through the 200-day moving average and the upper Bollinger band at 507. These levels may serve the points of entry. The initial risk-limit may be placed below the Parabolic signal, Bollinger band and the last fractal low at 465. Having opened the pending order, we shall move the stop to the next fractal low following the Parabolic and Bollinger signals. Thus, we are changing the probable profit/loss ratio to the breakeven point. The most risk-averse traders may switch to the 4-hour chart after the trade and place there a stop-loss moving it in the direction of the trade. If the price meets the stop-loss level at 465 without reaching the order at 500 or 507, we recommend cancelling the position: the market sustains internal changes which were not taken into account.
Position Buy Buy stop above 500 or 507 Stop loss below 465
