Monthly USDA report: Rice
The USDA has released its monthly rice report for March. In 2015/16 farming season the US crops are expected to contract by 5% compared to the previous season. By the end of this season, rice stocks are to fall by 10% year on year to 43.9 mln hundredweights (1cwt=100 pounds, or around 45kg). Will the rice price edge up?
Global rice production is to total 417.1mln tons this season, which is 2% below the last year’s level according to USDA report. This is the lowest output in the recent 4 years. The production is expected to rise in India and to fall in Indonesia. At the same time, global rice consumption is likely to increase by 0.6% since previous year to 484.2mln tons. The USDA report forecasts the contracted rice crops will lead to 13% lower global stocks, which are to fall to 1.3mln tons.

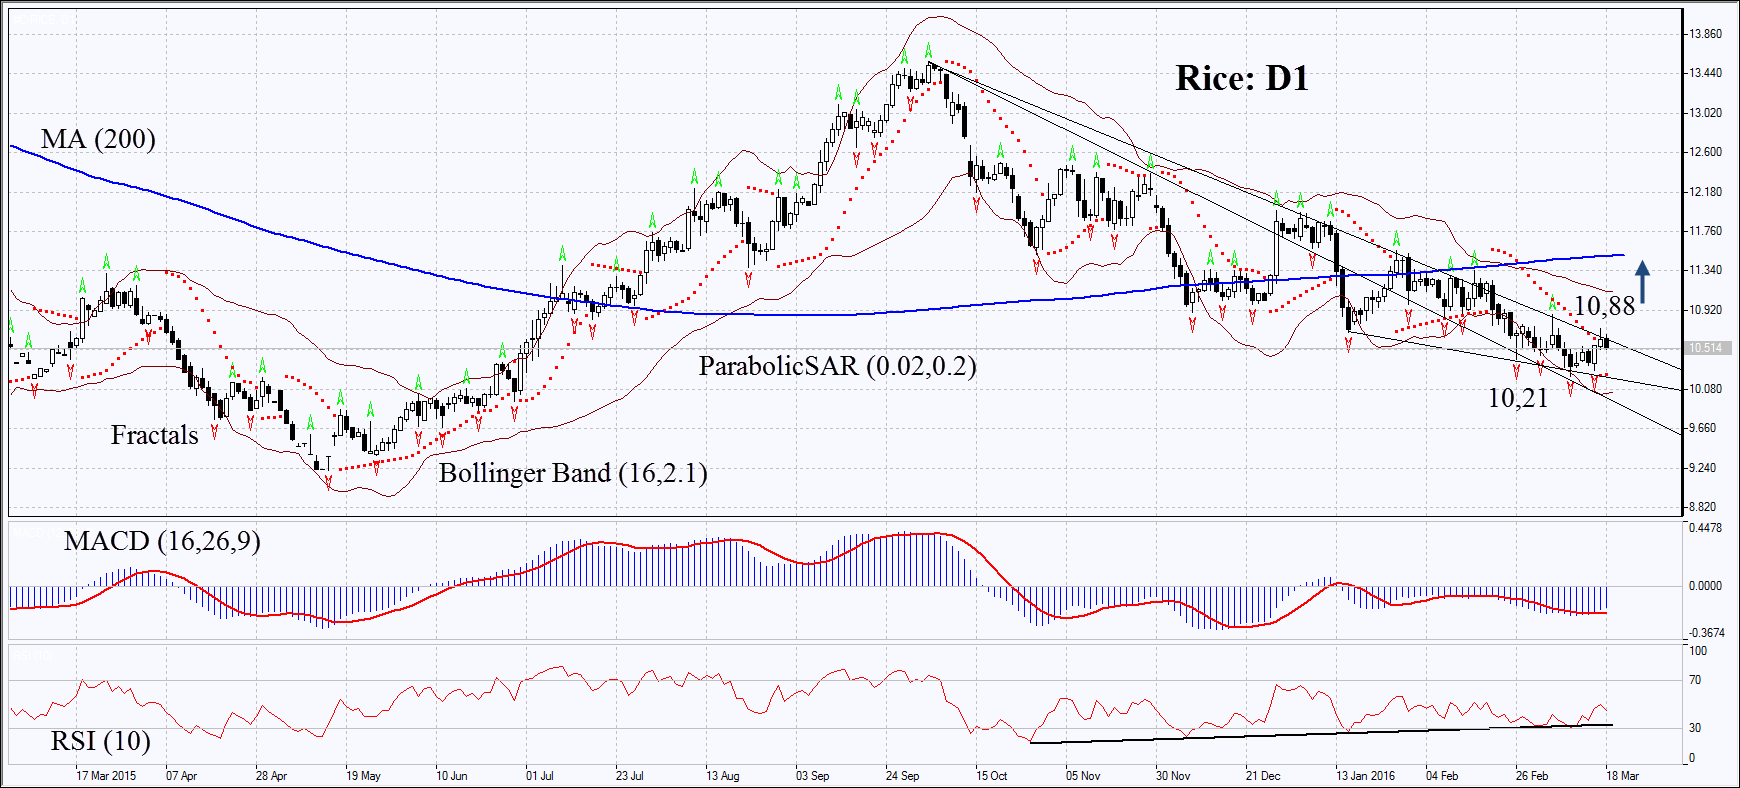
On the daily chart Rice: D1 is remaining in the downtrend. Nevertheless, the Parabolic and MACD indicators have formed the signals to buy. RSI is on the rise but has not yet reached the level of 50. It has been forming the positive divergence for a long time. The Bollinger bands have widened which may mean higher volatility. The bullish momentum may develop in case the rice prices surpass the last fractal high at 10.88. This level may serve the point of entry. The initial risk-limit may be placed below the Parabolic signal and the two last fractal lows at 10.21.
Having opened the pending order we shall move the stop to the next fractal low following the Parabolic and Bollinger signals. Thus, we are changing the probable profit/loss ratio to the breakeven point. The most risk-averse traders may switch to the 4-hour chart after the trade and place a stop-loss there, moving it in the direction of the trade. If the price meets the stop-loss level at 10.21 without reaching the order at 10.88, we recommend cancelling the position: the market sustains internal changes which were not taken into account.
Position: Buy
Buy stop: Above 10.88
Stop loss: Below 10.21
