Rice quotes are far ahead of the other grains
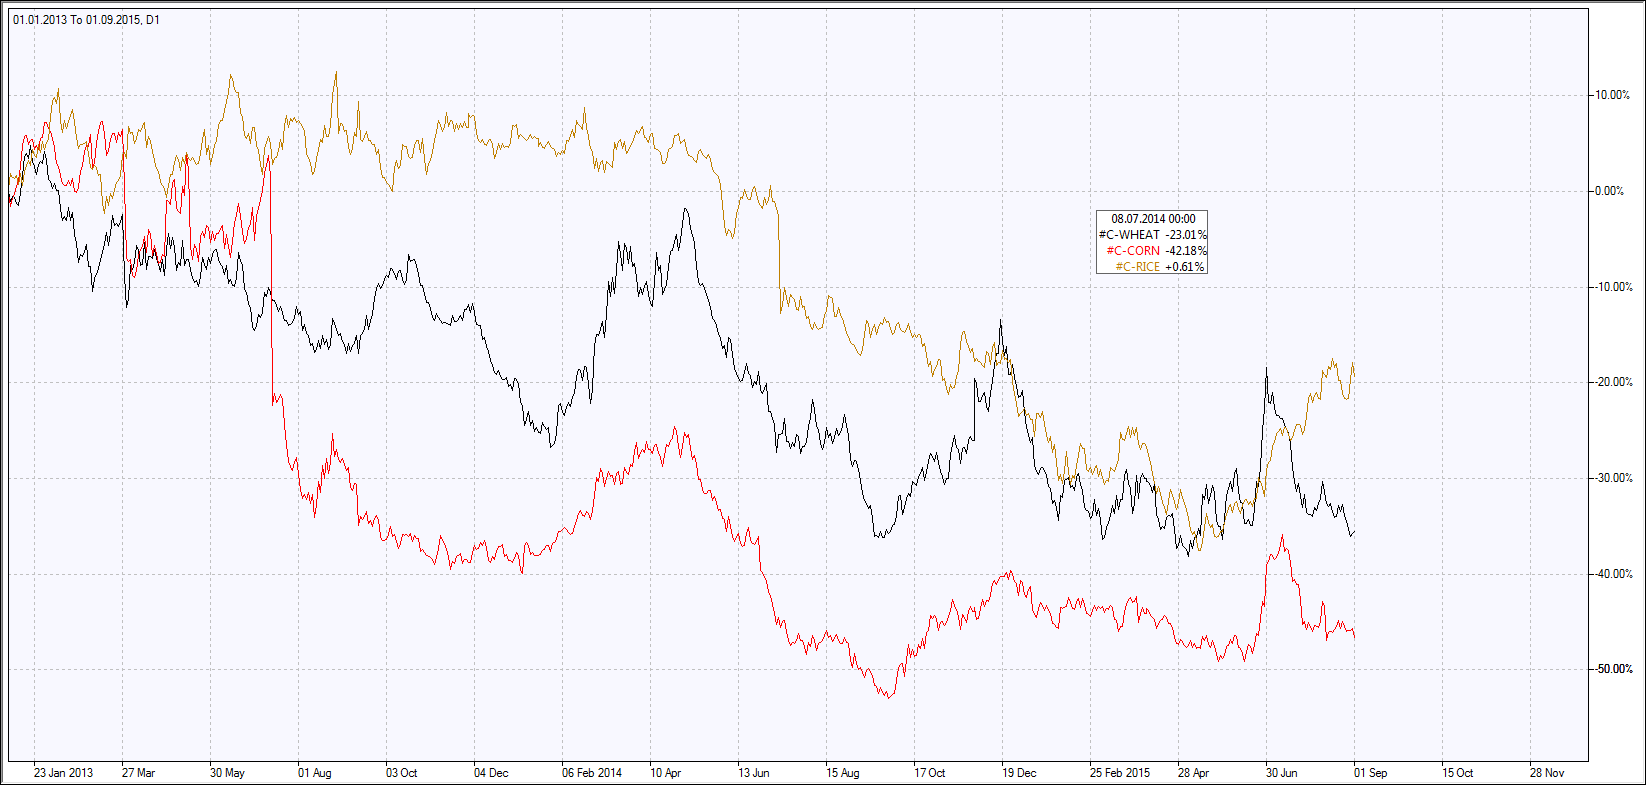
Since the start of the year, wheat has plunged by 17.8%, corn by 7.6%, while rice has gained 5.4%. Surely, rice is the traditional food stuff in Southeast Asia, yet it usually costs three times more than wheat. Given the oppositely directed price movements, rice may become less appealing compared to grains. In 2014, wheat, corn and rice lost 20%, 40% and 22% respectively. Thus, rice prices were more or less in line with the grains price dynamics last year. At this moment, wheat and corn are at the lowest in 5 years level, and retracement up is possible. Therefore, we suggest two diverse rice positions.

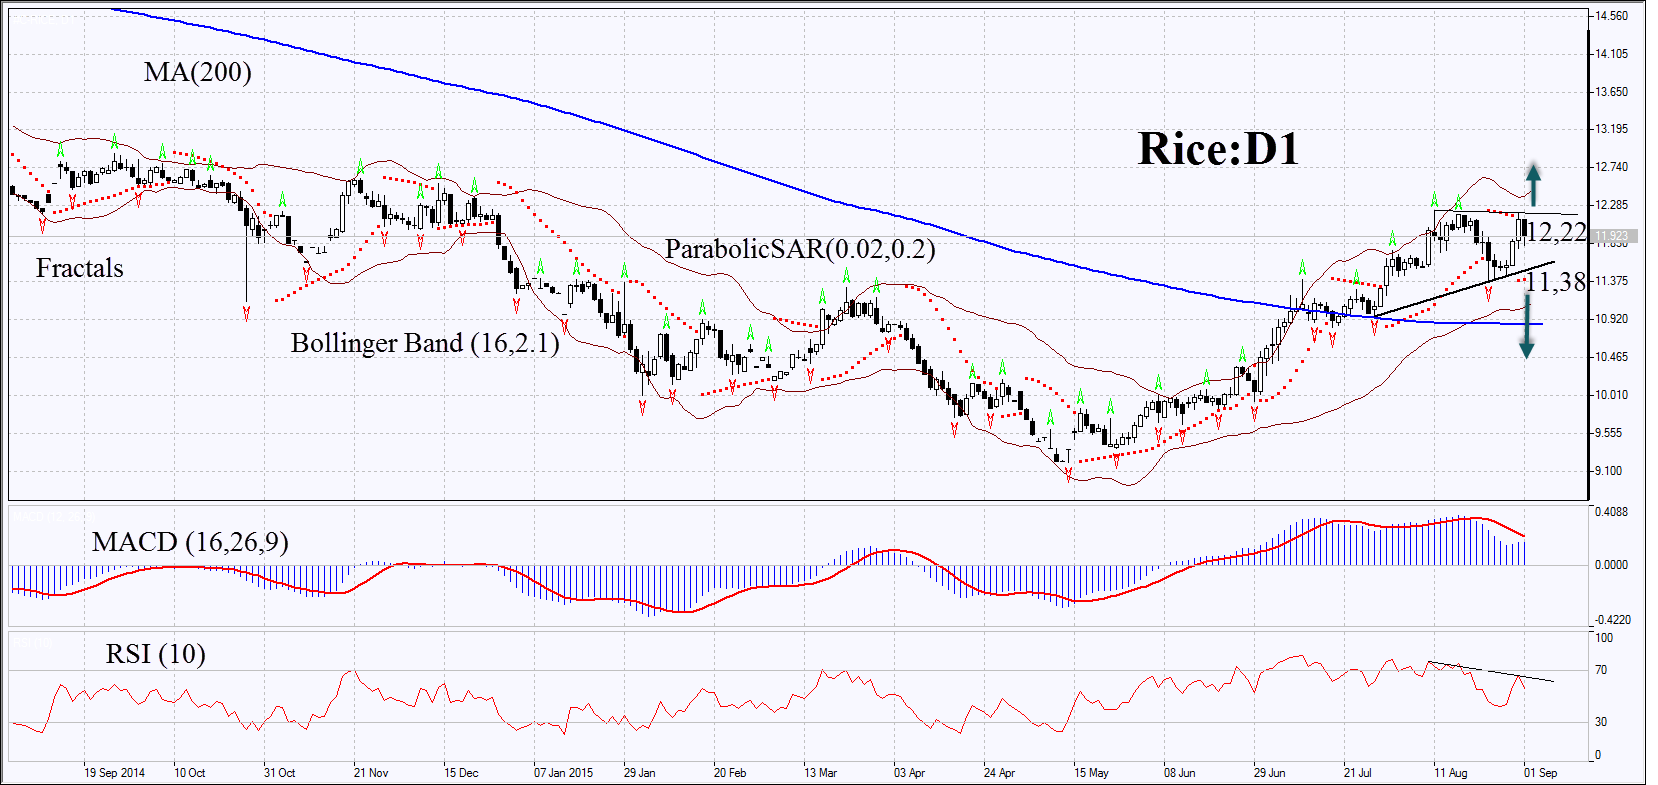
On the daily chart, the Rice:D1 is in the uptrend above the 200-day moving average. For the last days, it has been forming the triangle chart pattern. The Bollinger Bands® haven’t yet started to descend. The MACD Indicator gives the Sell signal, while Parabolic recommends to Buy. RSI is above the level of 50 and is forming the bearish divergence. In our opinion, the momentum may be formed after surpassing the two upper fractals and Parabolic signal of 12.22 on in case of falling below the last lower fractal and the Parabolic signal of 11.38. The direction of the trade is up to the market. Two or more positions may be placed symmetrically: having opened one of the orders, the second is to be deleted, as the market has chosen the direction. Having opened the delayed order, we shall move the stop to the next fractal maximum (short position) and fractal minimum (long position) following the Parabolic signal every 4 hours. The most risk-averse traders may switch to the 4-hour chart after the trade, and to place there a stop-loss, moving it in the direction of the trade. By doing this, we adjust the potential profit/loss ratio in our favour.
Position Sell Sell stop below 11,38 Stop loss above 12,22
Position Buy Buy stop above 12,22 Stop loss below 11,38
