Cotton outlook uncertain
China’s imports of cotton fell in 2015 as country’s growth slowed. Cotton imports of world’s biggest cotton consumer are expected to fall in 2015-16. Will cotton fall with expected decline of import demand?
Chinese cotton imports in December were 188,200 tonnes, down 29% year on year. Demand from the world's largest cotton consumer remains depressed as China’s economic growth slows down and Beijing granted less low-tariff import quotas in order to boost consumption of domestic supplies. Total imports in 2015 were 1.48 million tonnes, at lowest level in nine years. Domestic prices fell earlier this month to levels close to import prices on expectations that Beijing was preparing to auction off more of its estimated 11m tonnes of inventories. This may result in lower imports. The US Department of Agriculture estimates Chinese imports for 2015-16 at 1.2 million tonnes, down from 1.8 million in the prior crop year. While expected lower imports from China will negatively impact the demand for cotton, a 10% planned cut in Uzbekistan’s cotton output over the next five years should provide support for cotton prices. Uzbekistan is the world's fifth biggest cotton producer, and plans to cut production 0.5m tonnes to 3.0m tonnes by 2020 as irrigated lands will be used for more vegetable farming.
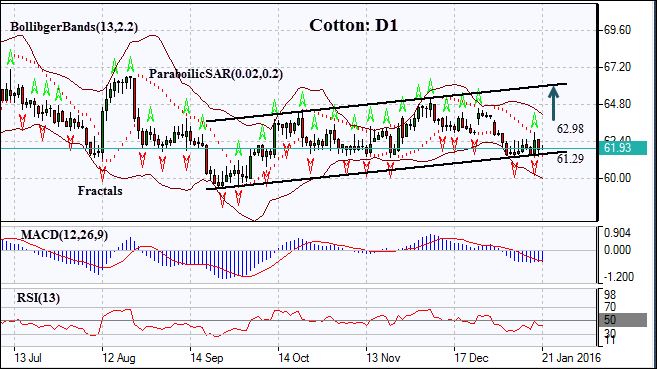
On the daily timeframe, the Cotton: D1 has been trading within an uptrend channel for the last three months. The price is edging up along the lower channel and the Parabolic indicator has formed a buy signal. The width of Bollinger bands® hasn’t changed in the last couple of weeks, which indicates steady volatility. The RSI oscillator is rising towards the 50 level. The MACD indicator is below the signal line, but the gap with the signal line is falling and the signal line is edging up. This is a bullish signal. We believe the closing above the fractal high at 62.98 will signify the continuation of bullish momentum. A pending order to buy can be placed above that level. The stop loss can be placed below the fractal low at 61.29, confirmed also by the lower channel and Parabolic signals. After placing the order, the stop loss is to be moved every day to the next fractal low, following Parabolic signals. Thus, we are changing the probable profit/loss ratio to the breakeven point. The most risk-averse traders may switch to the 4-hour chart after the trade and place there a stop-loss moving it in the direction of the trade. If the price meets the stop loss level at 61.29 without reaching the order, we recommend cancelling the position: the market sustains internal changes which were not taken into account.
Position Buy Buy stop above 62.98 Stop loss below 61.29
