Awaiting USDA report
On Tuesday, January 12, at 18:15 СЕТ the USDA will publish the forecast of cotton production volume and stockpiles at the end of 2015/16 season. Now the cotton price is hovering around the 6-year low since late August. Meanwhile, Pakistan expects its production to contract by 0.5mln bales of 480 pounds this season to 7.5mln bales which is the lowest since 1999. Pakistan ranks 4th among cotton producers and is one of its major importers with advanced light industry. Will cotton continue edging up?
Besides the expected crops fall in Pakistan, some other factors may determine the cotton prices as well. By the start of the last year, the global cotton prices fell by around 40% since 2014 to 8.56mln acres. For this reason, the cotton crop acres in the US fell to the 30-year low in 2015. Markets expect this year it may increase by 13% to 9.7mln acres while the estimate vary from 9 to 11mln acres. In our opinion, the official USDA outlook for the crop acres may influence the cotton prices. Another significant indicator is the outlook for the global cotton stockpiles in 2015/16. The reading is expected to exceed 100mln bales.
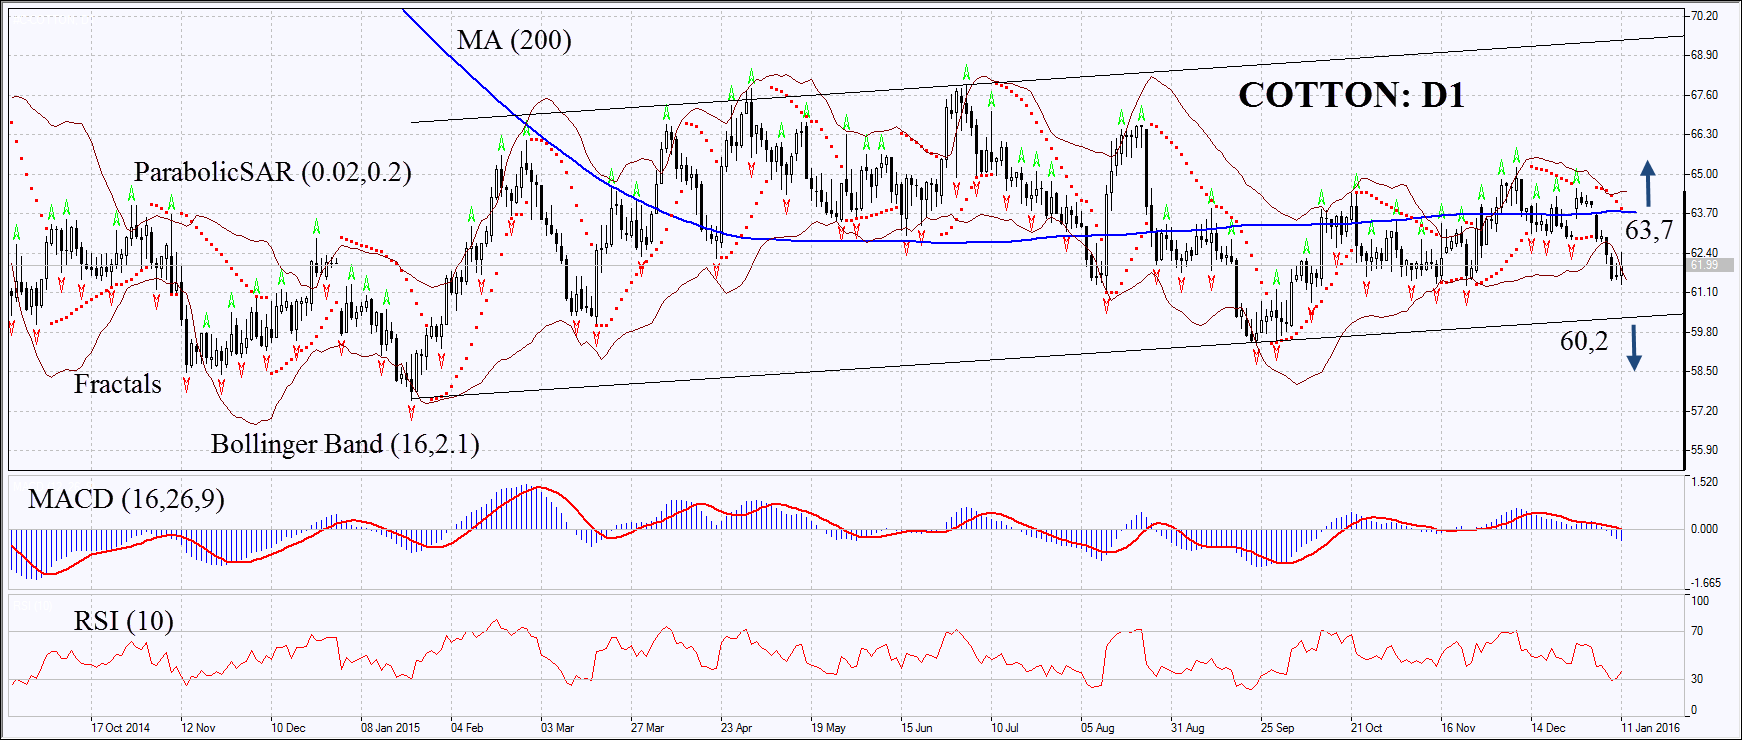
On the daily chart Cotton:D1 is within a price trend slightly tilted upwards almost for a year. Parabolic and MACD indicators give sell signals. RSI has slightly corrected upwards from the oversold zone, no divergence. The Bollinger Bands® are widening which may mean higher volatility. The momentum may develop in case the chart surpasses the 200-day moving average and the Parabolic signal at 63.7 or in case of falling below the lower price channel boundary at 60.2. The market will choose the direction. Two or more positions may be placed symmetrically: having opened one of the orders, the other may be deleted as the market has chosen the direction. Having opened the pending order we shall move the stop to the next fractal high (short position) and fractal low (long position) following the Parabolic signal every 4 hours. The most risk-averse traders may switch to the 4-hour chart after the trade and place there a stop-loss moving it in the direction of the trade. Thus, we are changing the probable profit/loss ratio to the breakeven point. If the price meets the stop-loss level without reaching the order, we recommend cancelling the position: the market sustains internal changes which were not taken into account.
Position Sell Sell stop below 60.2 Stop loss above 63.7
Position Buy Buy stop above 63.7 Stop loss below 60.2
