El Niño Vs. Weak Brazilian Real
More and more numerous public and private companies all over the world are speaking of El Niño to appear this year. On Friday the National Federation of Coffee Growers in Colombia (FNC) stated that El Niño threatens 20% of the outlook for the 2015 coffee crops. Will it cause the world market price growth?
The coffee production in Columbia is expected to amount to 13 million of 60kg bags so far. El Niño may cause the drought. According to FNC, this will cause not only reduced crops, but the 50% rise of the labour costs on farms for growers as they will have to hire more workers to combat the coffee beetles proliferating in dry weather.
Columbia ranks fourth among the coffee producers with 7.5% market share. The world leader is Brazil accounting for a third of the world crops, the overall share of Latin America being 53%. The worse weather conditions may provoke the price growth. According to the U.S. Commodity Futures Trading Commission, the gross shorts were up for the fourth consecutive week showing the highest volume since November 2013 with the prices remaining pretty the same.
It is hard to determine the final direction of the market. The weakening Brazilian real is the prevailing bearish factor for coffee. It improves significantly the competitiveness of the Brazilian exporters allowing them to reduce prices. Since the start of the year the real to dollar exchange rate is down almost by a third. Let’s consider opening the long position.
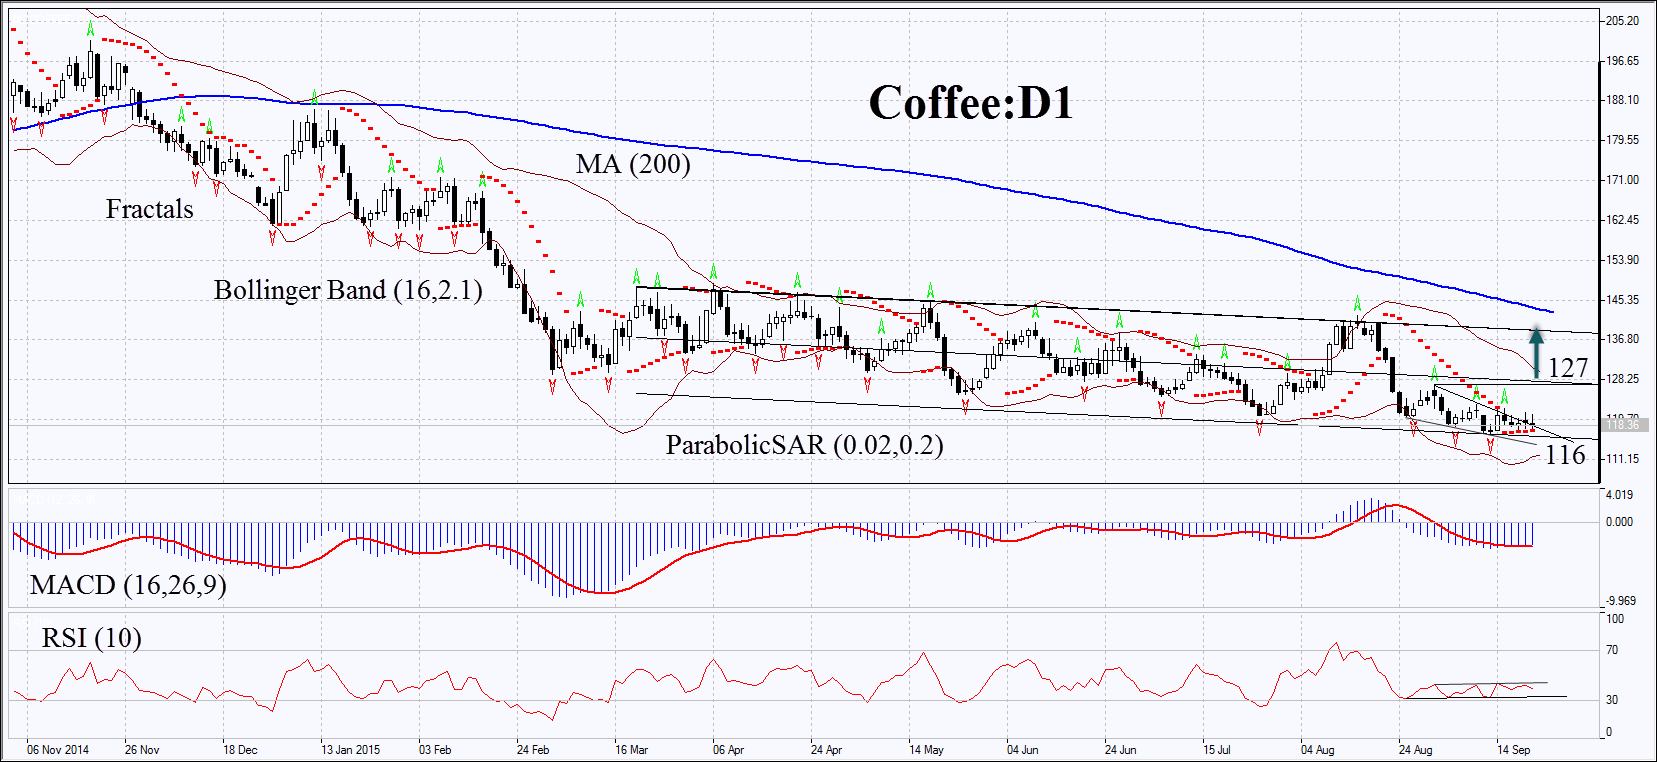
On the daily chart, coffee is in the downtrend below its 200-day moving average. Coffee has verged the lower trendline, but failed to break it through. The MACD and Parabolic indicators give the buy signals. The RSI has not yet reached the oversold zone having formed the positive divergence. It remains below 50. The Bollinger Bands® are contracting which may mean low volatility.
The bullish momentum may appear subject to coffee prices surpassing the fractal high of 127. This level may be used as the point of entry. The preliminary risk limit may be placed below the 2-year low of 116. Having opened the delayed order we shall move the stop to the next fractal low (long position) following the Parabolic and Bollinger signals every four hours.
By doing this we adjust the potential profit/loss ratio in our favour. The most risk-averse traders may switch to the 4-hour chart after the trade and place there a stop-loss moving it in the direction of the trade. If the price meets the stop-loss level of 116 without reaching the order of 127, we recommend cancelling the position: the market sustains internal changes which were not taken into account.
- Position Buy
- Buy stop above 127
- Stop loss below 116
