You are probably already familiar and may have even used the ‘simple moving average’ (SMA) technical indicator. The SMA values are determined by calculating the average price of an asset over a selected time period. In addition, you will find that this indicator uses its closing values as its main basis for determining its readings. For example, a 10-day SMA is computed by adding the closing values of the last 10 trading days and then dividing the total by 10.
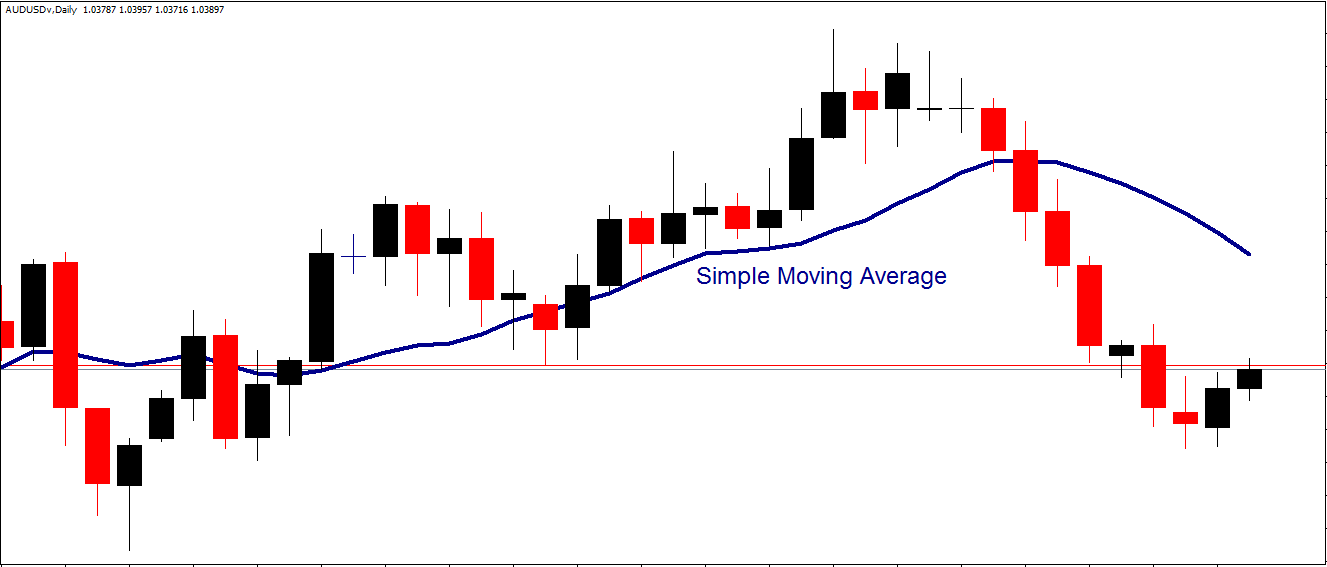
The above diagram shows the SMA as a blue line. The main feature that you should recognize is that the SMA is a lagging indicator and, as such, is not very good at predicting price movements but just tracking them. You can also confirm from studying the above chart that price changes direction quicker than the SMA. This is why the SMA is classified as a trend-following indicator. As such, you need to realize that the SMA performs best when price is trading within a definitive trend. However, the SMA can supply you with misleading signals when price is range-bound.
To overcome these problems, the EMA was created which is also termed the ‘exponentially weighted moving average’. The main point that you need to remember is that the EMA reduces the lagging problem experienced by the SMA by emphasizing its newer readings in preference to its older ones.
This weighting depends on the specific time period that you select when using the EMA. For instance, if you use a shorter EMA period, then more weight will be applied to the most recent price. For example, a 20-period EMA weighs the last value it produced by 9.52%. In contrast, a 10-period EMA weighs its latest reading by 18.18%.
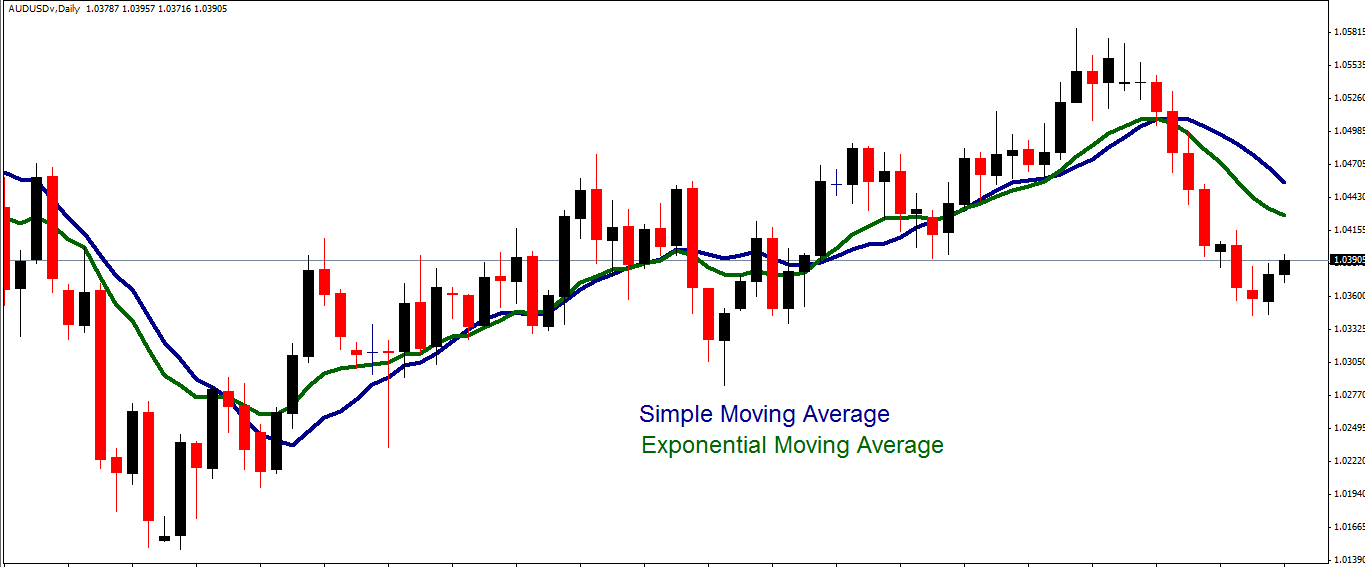
The most important concept for you to know about the EMA is that it emphasizes its most recent readings. As such, you will find that the EMA will respond faster to new price developments than the SMA, as shown in the next diagram. The SMA is the blue line and the EMA the green one.
If you compare the two in the above diagram, you will notice that the EMA does respond quicker than the SMA to changes in price direction. However, you must understand that each prior closing value within the specified time period is still used to calculate the EMA readings. This means that although the effects of older data diminish over time, they never fully disappear.
When you choose to use either the SMA or the EMA, one of your major considerations will be that although the SMA lags price, the EMA may be prone to quicker breaks and thereby supply you with false signals. Expert consensus advises that you should use the EMA with shorter time frames while utilizing the SMA will longer ones.
You will find that the EMA generates more trading opportunities than the SMA, but it is also more sensitive. As such, you must be aware that the EMA possesses a major disadvantage in that it is capable of producing larger quantities of false signals. In comparison, the SMA will proceed more slowly, but will generate fewer false alarms. As such, the SMA can prove to be more reliabl but it can signal new trading opportunities too late. You will need to experiment with both the SMA and EMA to optimize your trading results.
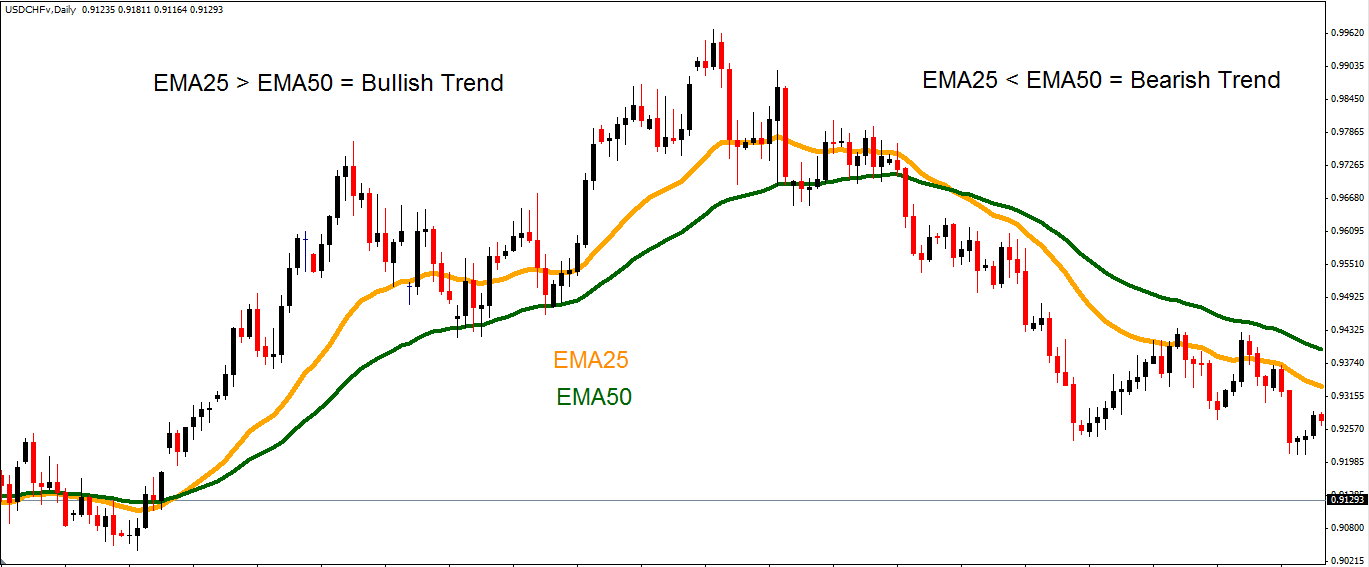
The EMA has many advantageous benefits that you can exploit to improve your trading profitability. For instance, the EMA is superior to the SMA at responding to price surges or spikes. In addition, this indicator is very good at tracking price as shown on the following chart.
Many traders exploit these advantages to help them easily detect if an asset is trading a bullish or bearish trend. Many software designers of automated trading solutions, such as expert advisors, also code the relevant features of the EMA into their tools to achieve the same objective.
You can easily do the same. For example, in the above diagram two EMAs are presented. One is colored yellow and has a 25-day time period while the second is green has possesses a 50-day period. A bullish trend is clearly identified towards the left of the above chart with EMA25 above EMA50. Similarly, a bearish trend is presented on the right when EMA25 has fallen below EMA50.
Original post
- English (UK)
- English (India)
- English (Canada)
- English (Australia)
- English (South Africa)
- English (Philippines)
- English (Nigeria)
- Deutsch
- Español (España)
- Español (México)
- Français
- Italiano
- Nederlands
- Português (Portugal)
- Polski
- Português (Brasil)
- Русский
- Türkçe
- العربية
- Ελληνικά
- Svenska
- Suomi
- עברית
- 日本語
- 한국어
- 简体中文
- 繁體中文
- Bahasa Indonesia
- Bahasa Melayu
- ไทย
- Tiếng Việt
- हिंदी
Technical Analysis And The ‘Exponential Moving Average’ (EMA)
Published 01/04/2013, 05:04 AM
Updated 07/09/2023, 06:31 AM
Technical Analysis And The ‘Exponential Moving Average’ (EMA)
Latest comments
Loading next article…
Install Our App
Risk Disclosure: Trading in financial instruments and/or cryptocurrencies involves high risks including the risk of losing some, or all, of your investment amount, and may not be suitable for all investors. Prices of cryptocurrencies are extremely volatile and may be affected by external factors such as financial, regulatory or political events. Trading on margin increases the financial risks.
Before deciding to trade in financial instrument or cryptocurrencies you should be fully informed of the risks and costs associated with trading the financial markets, carefully consider your investment objectives, level of experience, and risk appetite, and seek professional advice where needed.
Fusion Media would like to remind you that the data contained in this website is not necessarily real-time nor accurate. The data and prices on the website are not necessarily provided by any market or exchange, but may be provided by market makers, and so prices may not be accurate and may differ from the actual price at any given market, meaning prices are indicative and not appropriate for trading purposes. Fusion Media and any provider of the data contained in this website will not accept liability for any loss or damage as a result of your trading, or your reliance on the information contained within this website.
It is prohibited to use, store, reproduce, display, modify, transmit or distribute the data contained in this website without the explicit prior written permission of Fusion Media and/or the data provider. All intellectual property rights are reserved by the providers and/or the exchange providing the data contained in this website.
Fusion Media may be compensated by the advertisers that appear on the website, based on your interaction with the advertisements or advertisers.
© 2007-2025 - Fusion Media Limited. All Rights Reserved.
