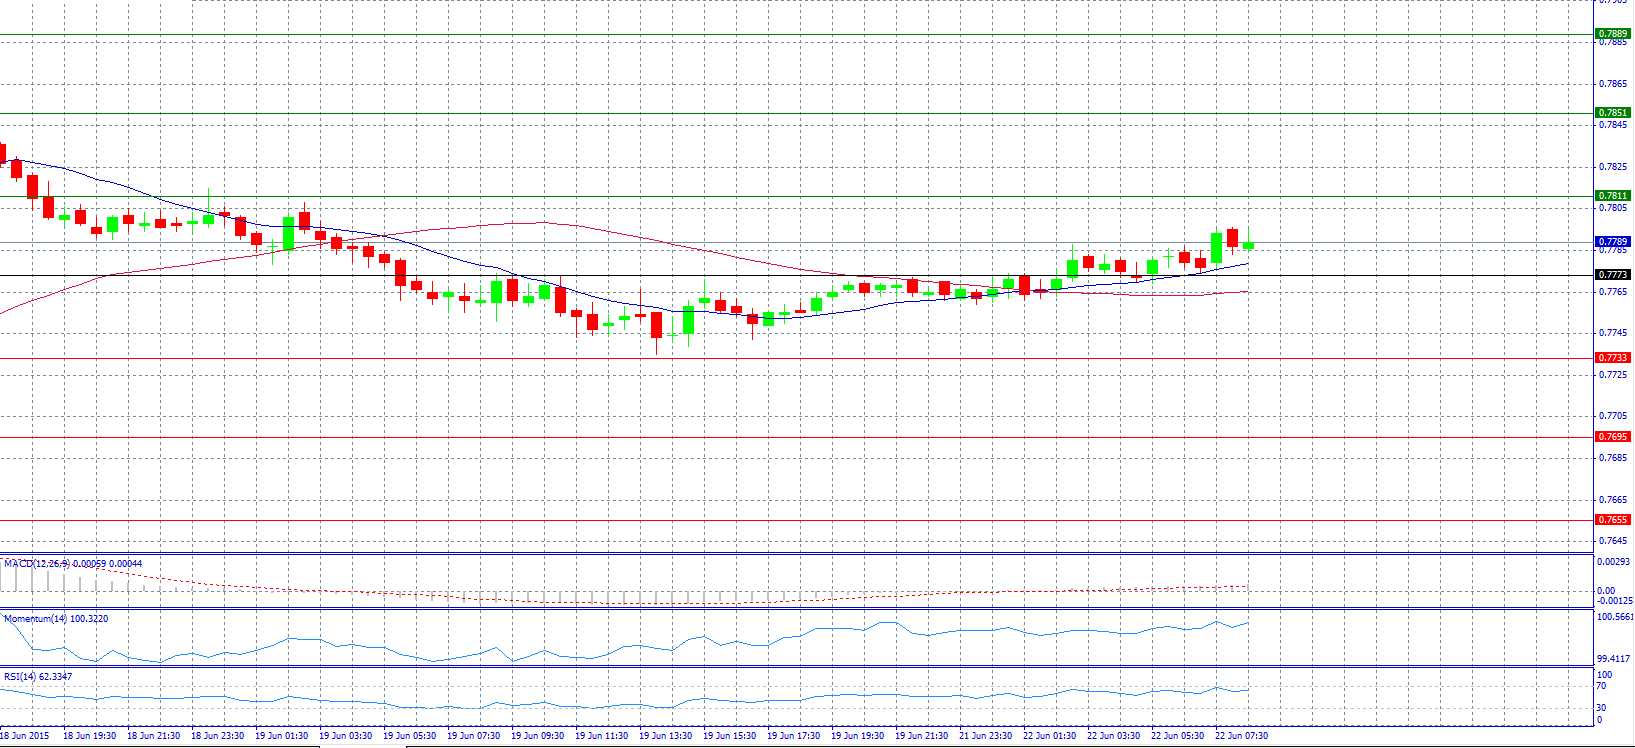
Market Scenario 1: Long positions above 0.7811 with target @ 0.7851.
Market Scenario 2: Short positions below 0.7773 with target @ 0.7733.
Comment: The pair trades higher in the Asian session near 0.7790 level.
Supports and Resistances:
R3 0.7889
R2 0.7851
R1 0.7811
PP 0.7773
S1 0.7733
S2 0.7695
S3 0.7655
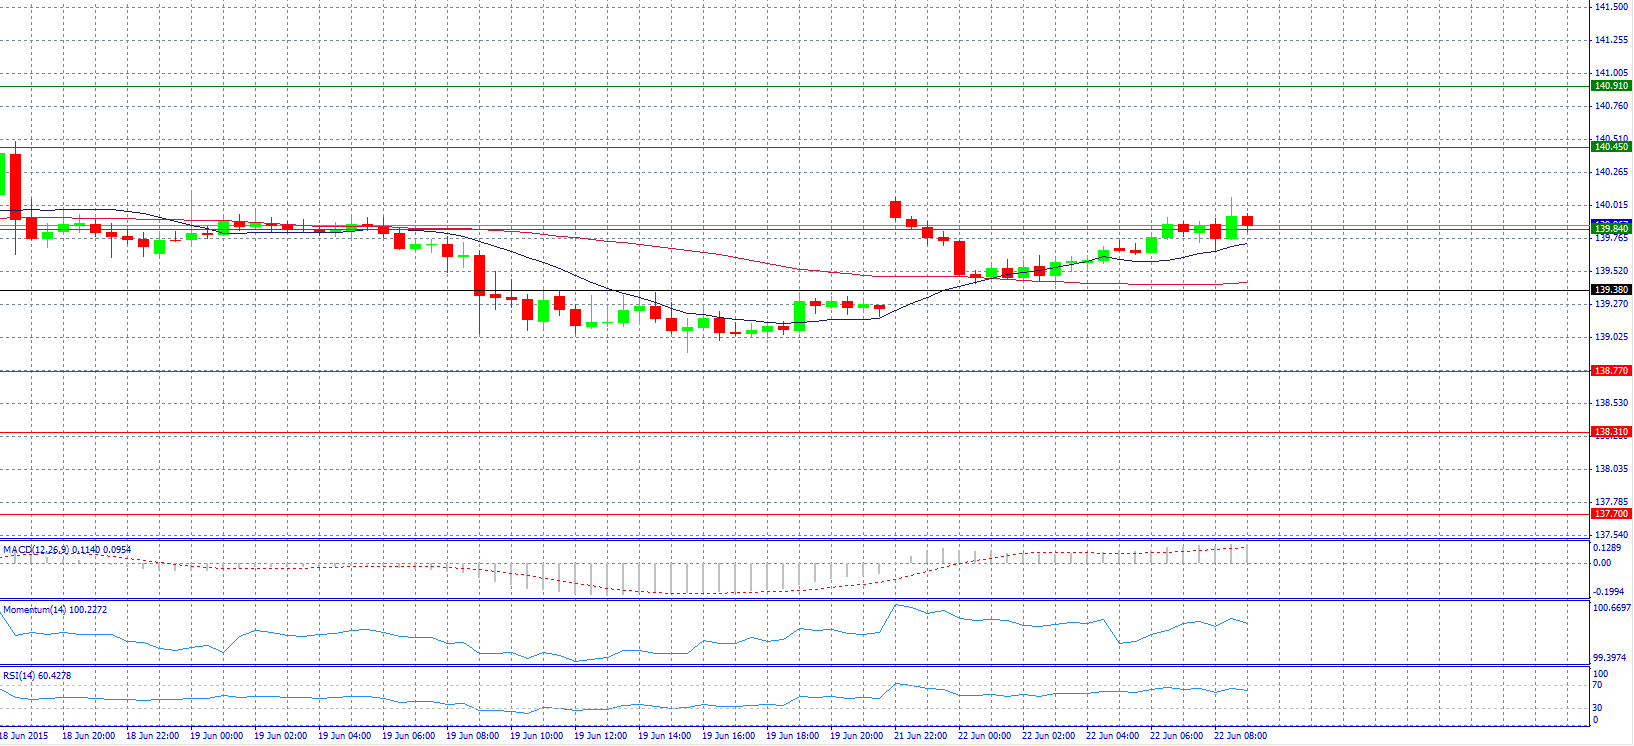
Market Scenario 1: Long positions above 139.84 with target @ 140.45.
Market Scenario 2: Short positions below 139.84 with target @ 139.38.
Comment: The pair has a bullish tone and trades tries to stay above resistance level 139.84.
Supports and Resistances:
R3 140.91
R2 140.45
R1 139.84
PP 139.38
S1 138.77
S2 138.31
S3 137.70
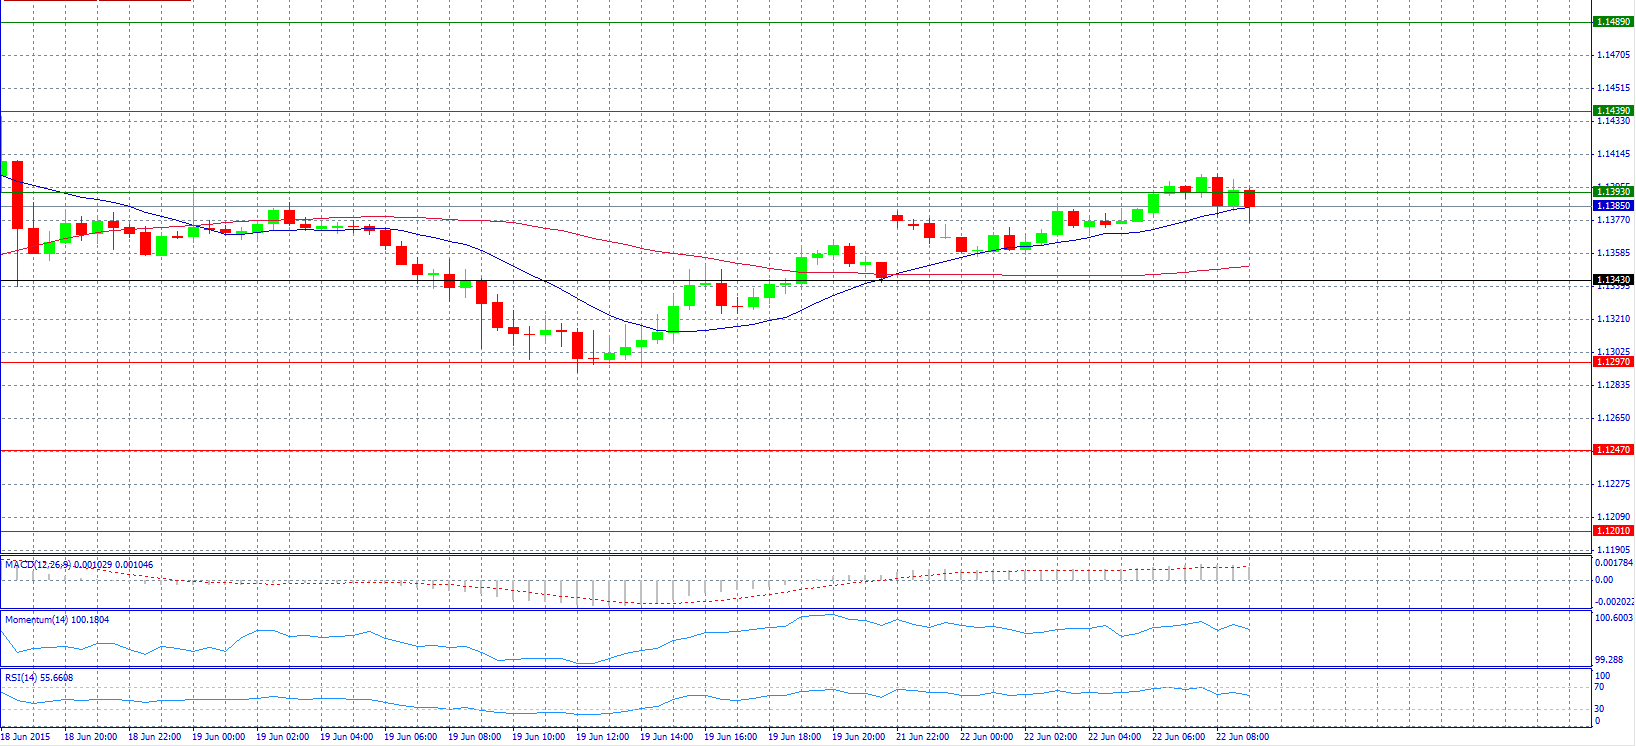
Market Scenario 1: Long positions above 1.1393 with target @ 1.1439.
Market Scenario 2: Short positions below 1.1393 with target @ 1.1343.
Comment: The pair trades higher ahead of the Euro-group meeting.
Supports and Resistances:
R3 1.1489
R2 1.1439
R1 1.1393
PP 1.1343
S1 1.1297
S2 1.1247
S3 1.1201
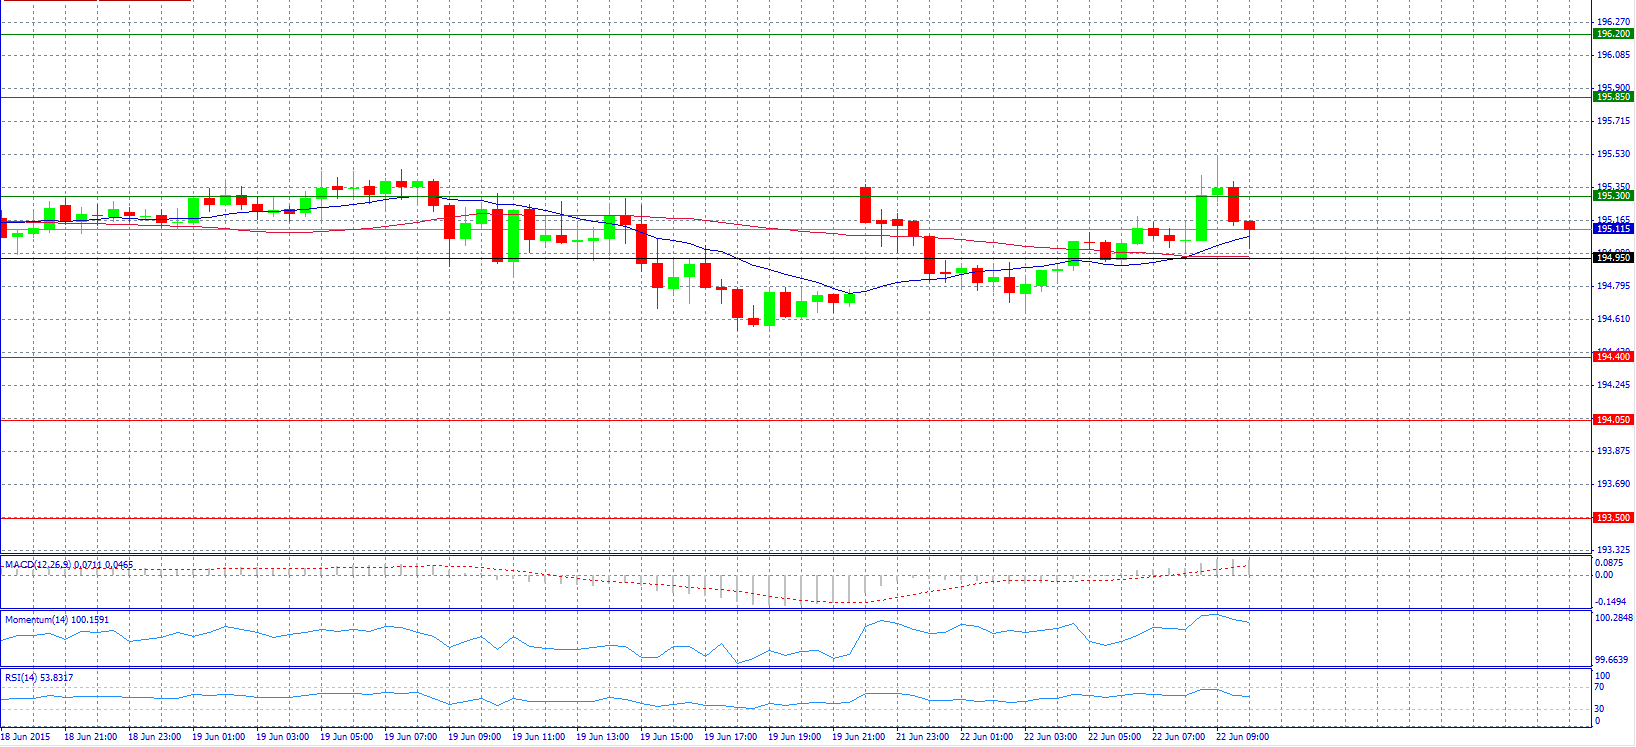
Market Scenario 1: Long positions above 195.30 with target @ 195.58.
Market Scenario 2: Short positions below 194.95 with target @ 194.40.
Comment: The pair rose to challenge resistance level 195.30 but dropped again.
Supports and Resistances:
R3 196.20
R2 195.85
R1 195.30
PP 194.95
S1 194.40
S2 194.05
S3 193.50
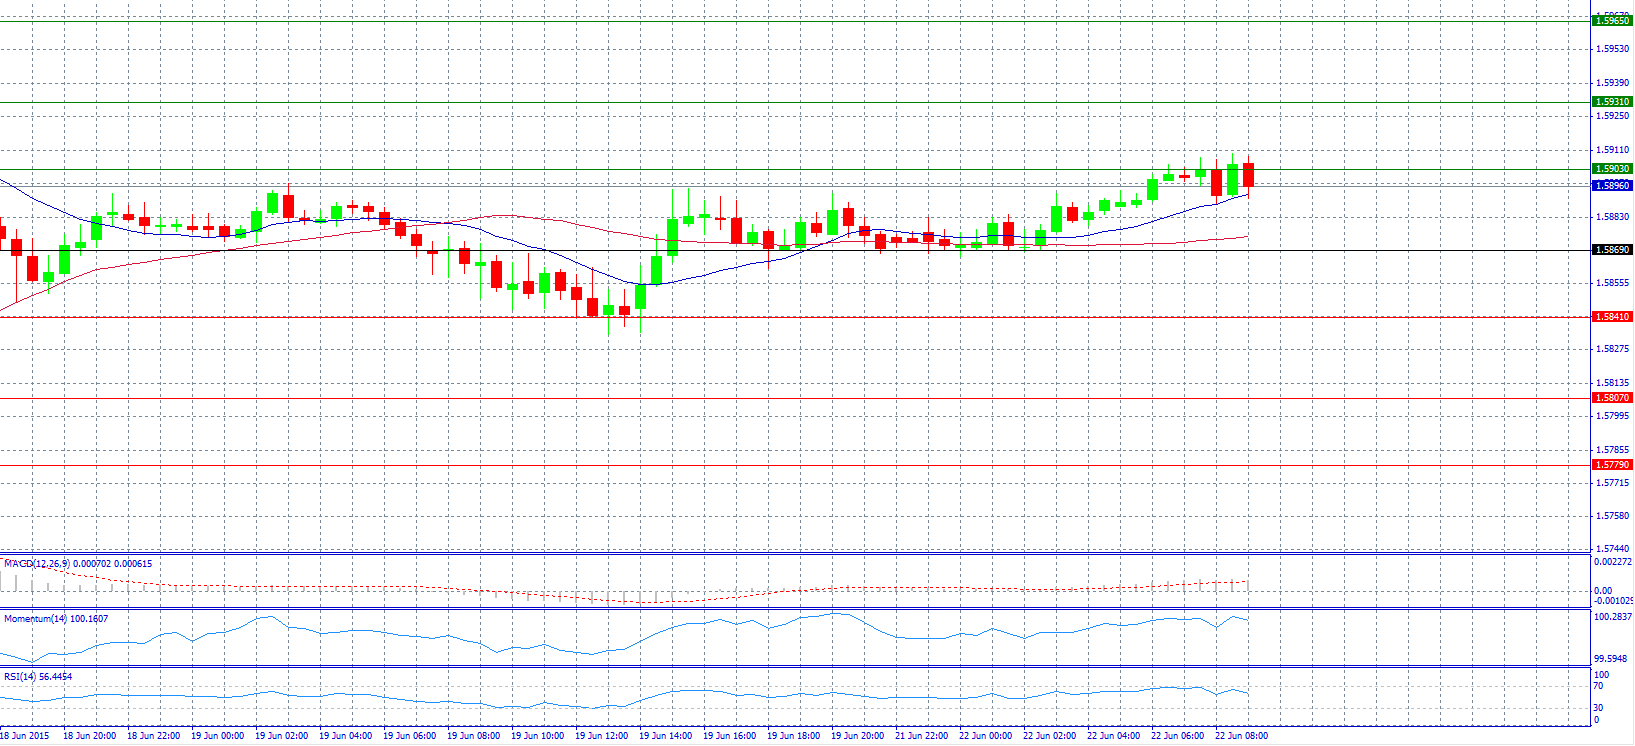
Market Scenario 1: Long positions above 1.5903 with target @ 1.5931.
Market Scenario 2: Short positions below 1.5903 with target @ 1.5869.
Comment: The pair reversed its losses in the early European session.
Supports and Resistances:
R3 1.5965
R2 1.5931
R1 1.5903
PP 1.5869
S1 1.5841
S2 1.5807
S3 1.5779
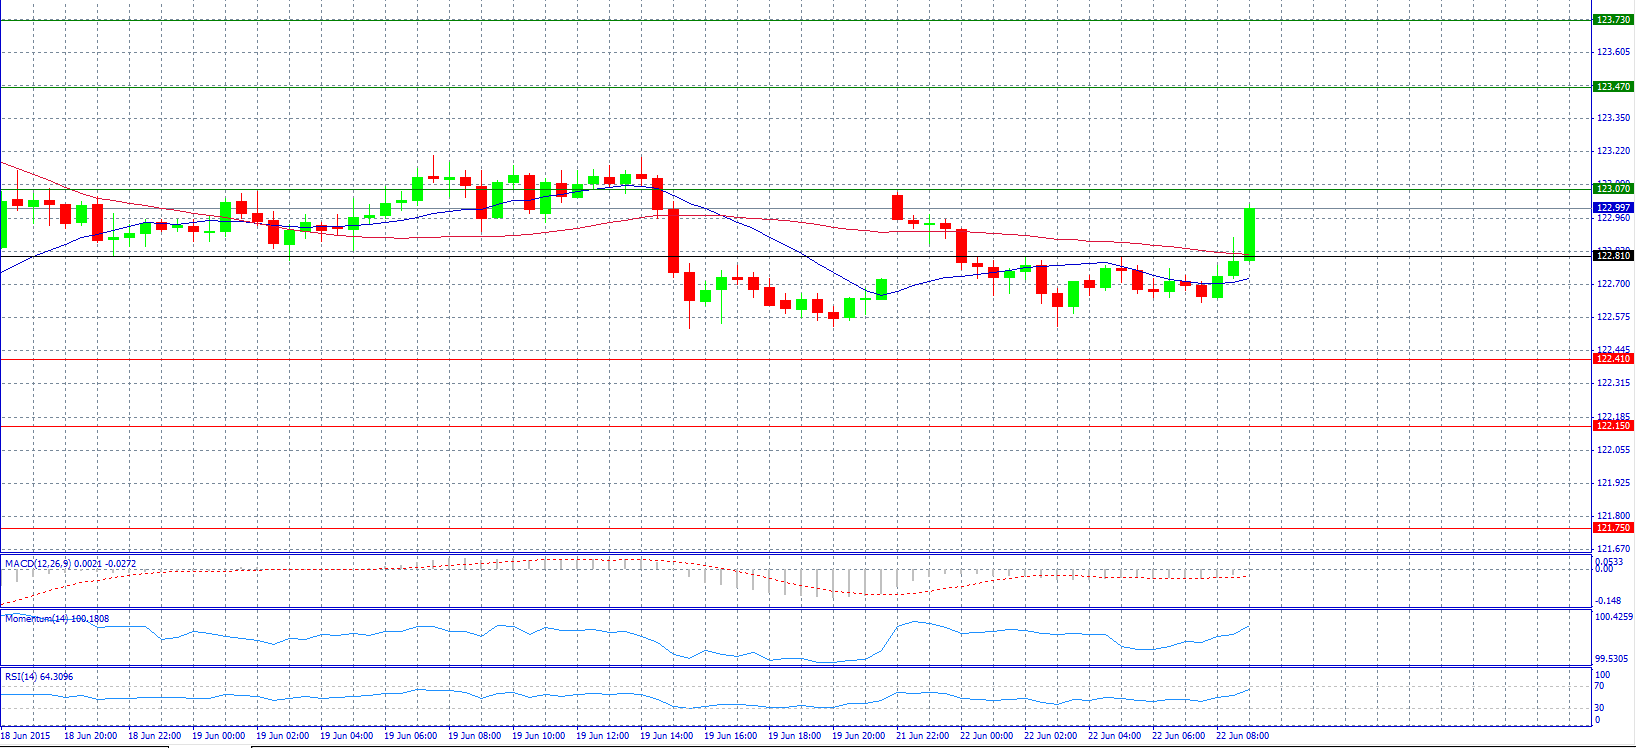
Market Scenario 1: Long positions above 123.07 with target @ 123.47.
Market Scenario 2: Short positions below 122.81 with target @ 122.41.
Comment: The pair jumped above pivot point and tries to reach resistance level 123.07.
Supports and Resistances:
R3 123.73
R2 123.47
R1 123.07
PP 122.81
S1 122.41
S2 122.15
S3 121.75
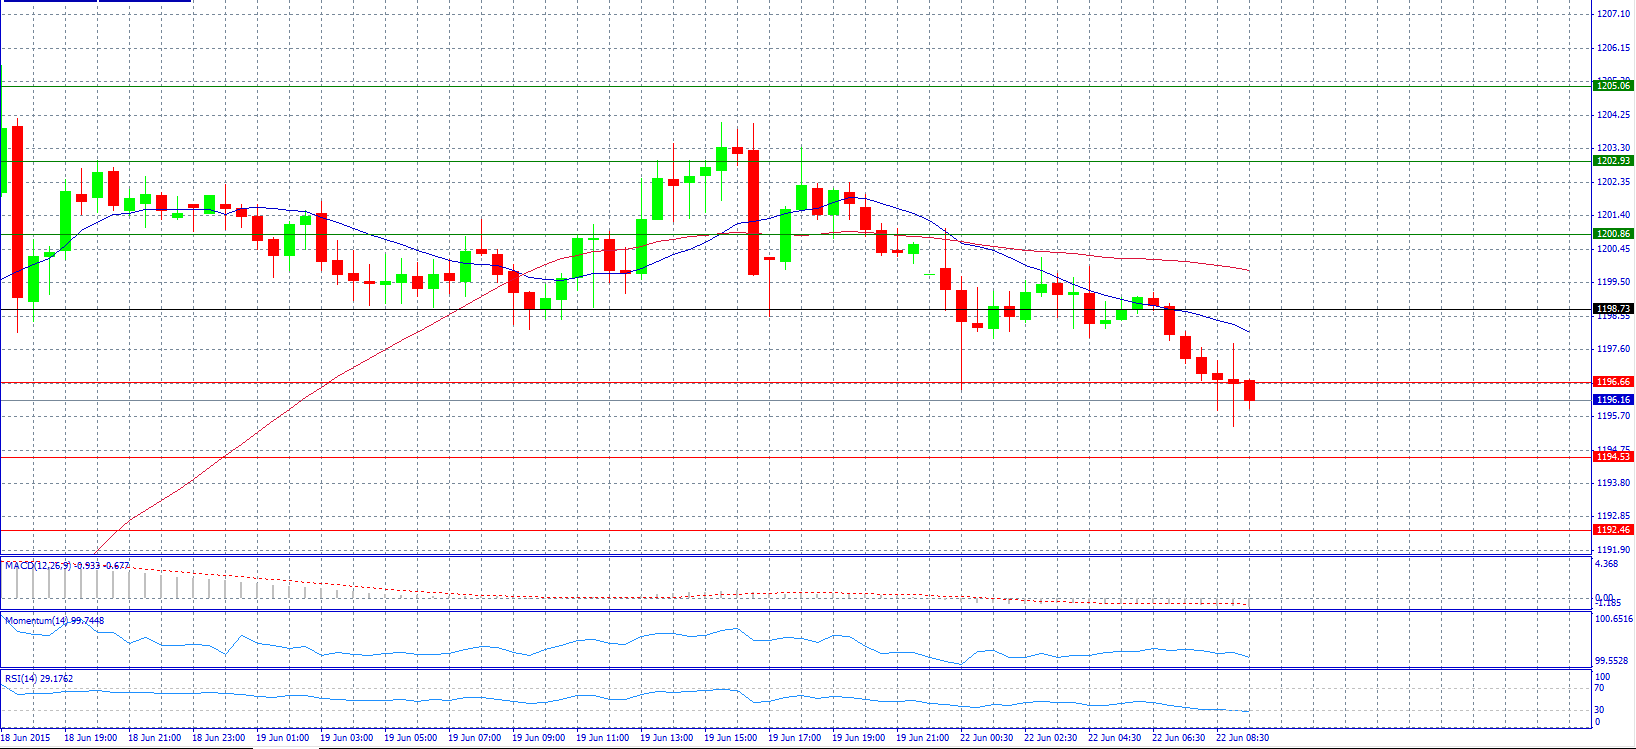
Market Scenario 1: Long positions above 1196.66 with target @ 1198.73.
Market Scenario 2: Short positions below 1196.66 with target @ 1194.53.
Comment: Gold prices perhaps slipping as hopes for a Greece deal tarnish its haven allure.
Supports and Resistances:
R3 1205.06
R2 1202.93
R1 1200.86
PP 1198.73
S1 1196.66
S2 1194.53
S3 1192.46
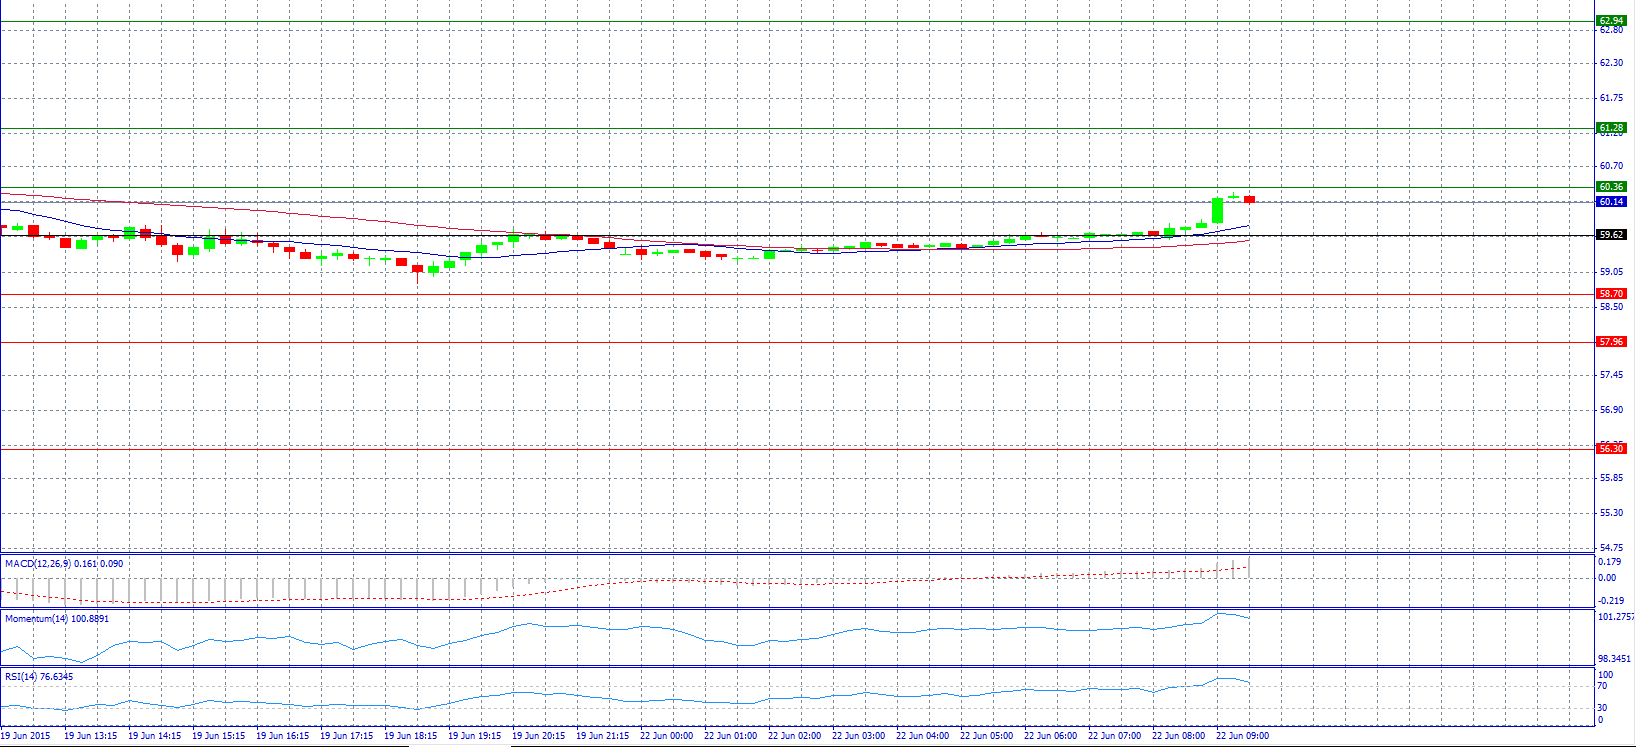
Market Scenario 1: Long positions above 60.36 with target @ 61.28.
Market Scenario 2: Short positions below 59.62 with target @ 58.70.
Comment: Crude oil prices were facing downward pressure due to concerns over the Greek financial crisis, according to analysts.
Supports and Resistances:
R3 62.94
R2 61.28
R1 60.36
PP 59.62
S1 58.70
S2 57.96
S3 56.30
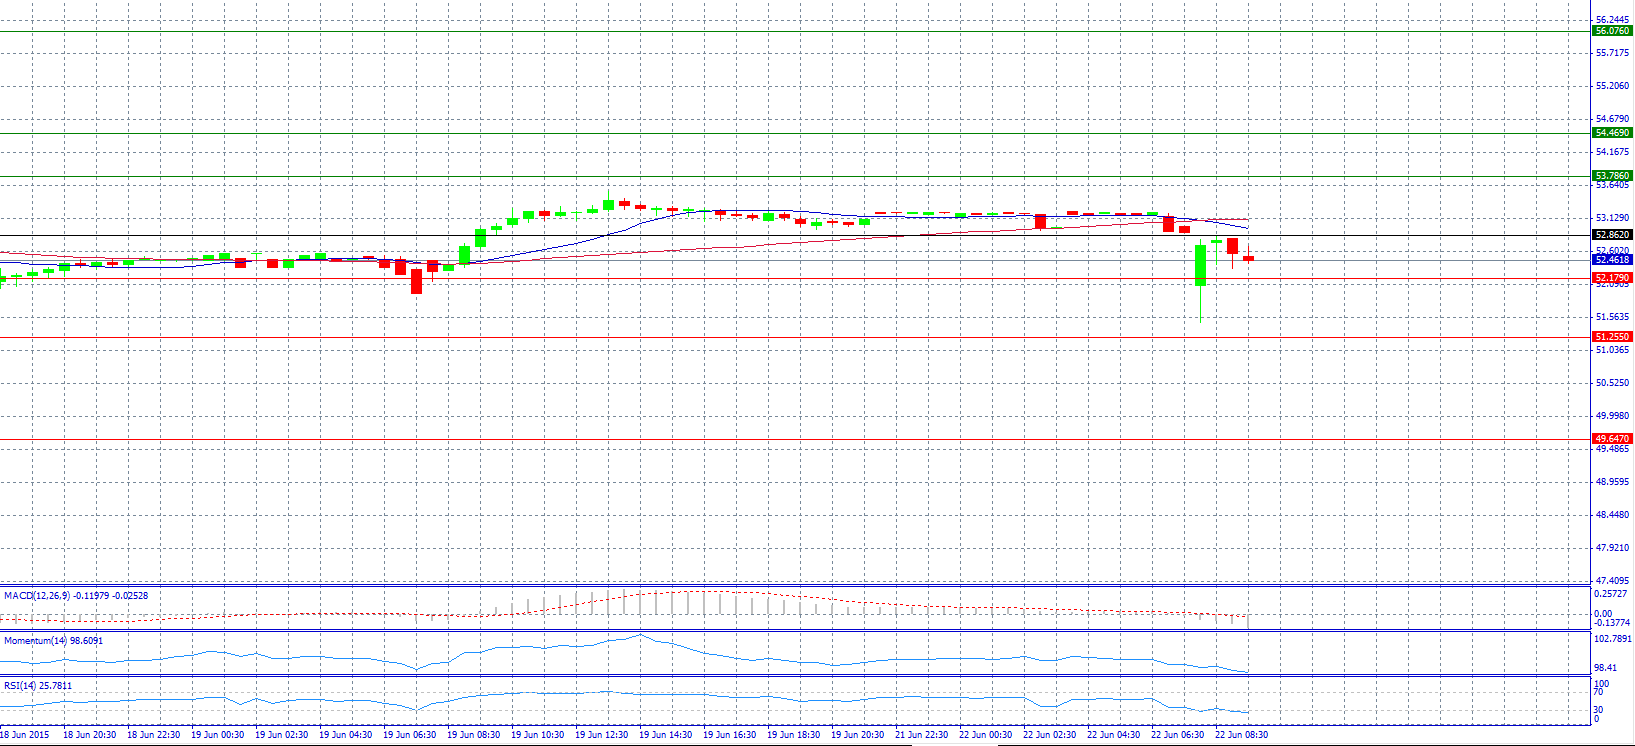
Market Scenario 1: Long positions above 52.862 with target @ 53.786.
Market Scenario 2: Short positions below 52.179 with target @ 51.255.
Comment: The pair has a bearish pressure and trade below pivot point 52.862.
Supports and Resistances:
R3 56.076
R2 54.469
R1 53.786
PP 52.862
S1 52.179
S2 51.255
S3 49.647
