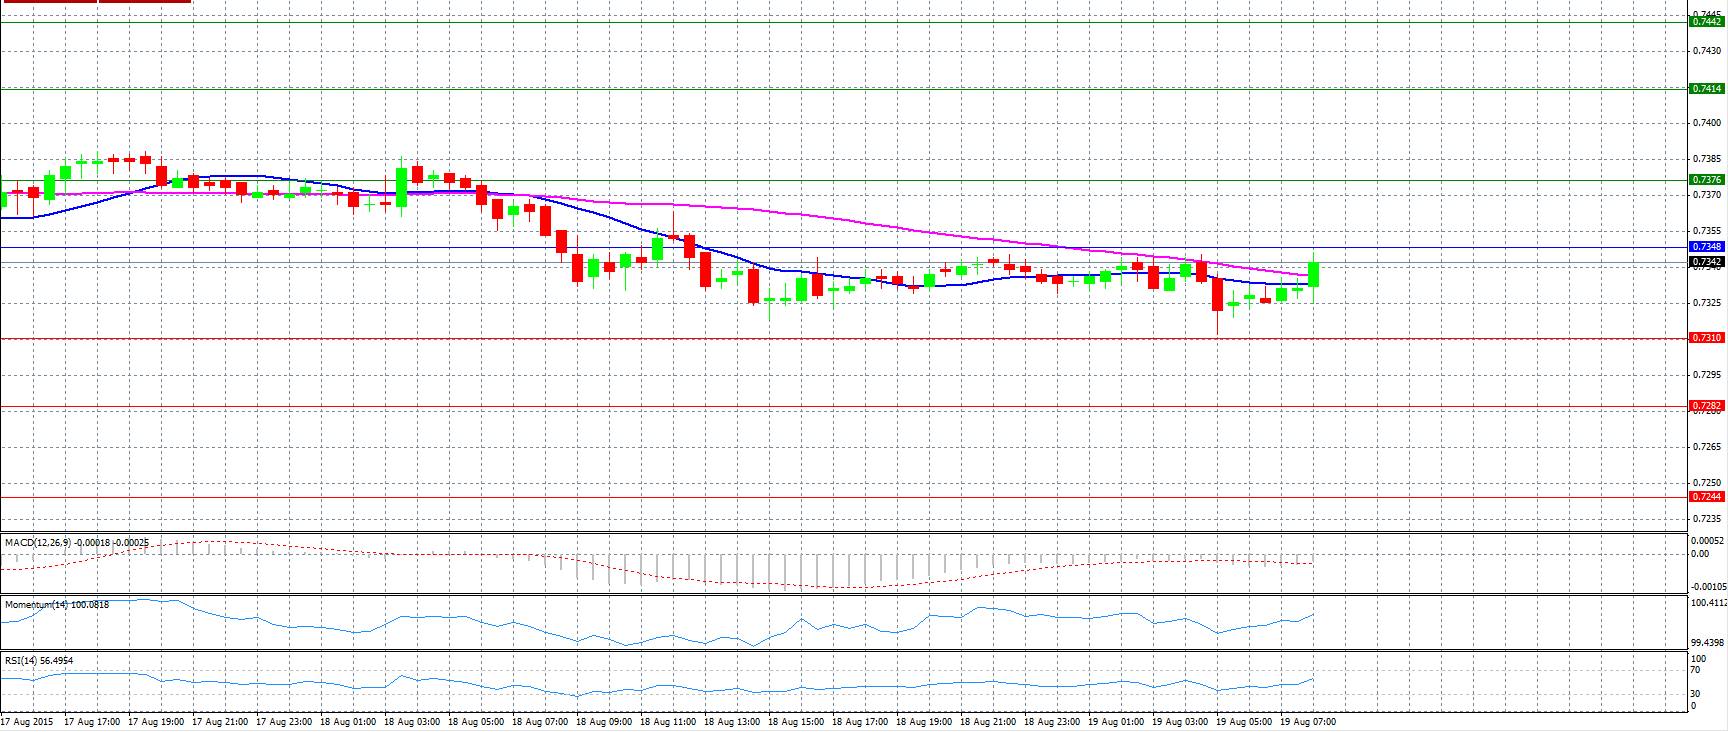
Market Scenario 1: Long positions above 0.7348 with targets at 0.7376 and 0.7414.
Market Scenario 2: Short positions below 0.7348 with targets at 0.7310 and 0.7282.
Comment: The pair trades lower after July leading index remains unchanged.
Supports and Resistances:
R3 0.7442
R2 0.7414
R1 0.7376
PP 0.7348
S1 0.7310
S2 0.7282
S3 0.7244
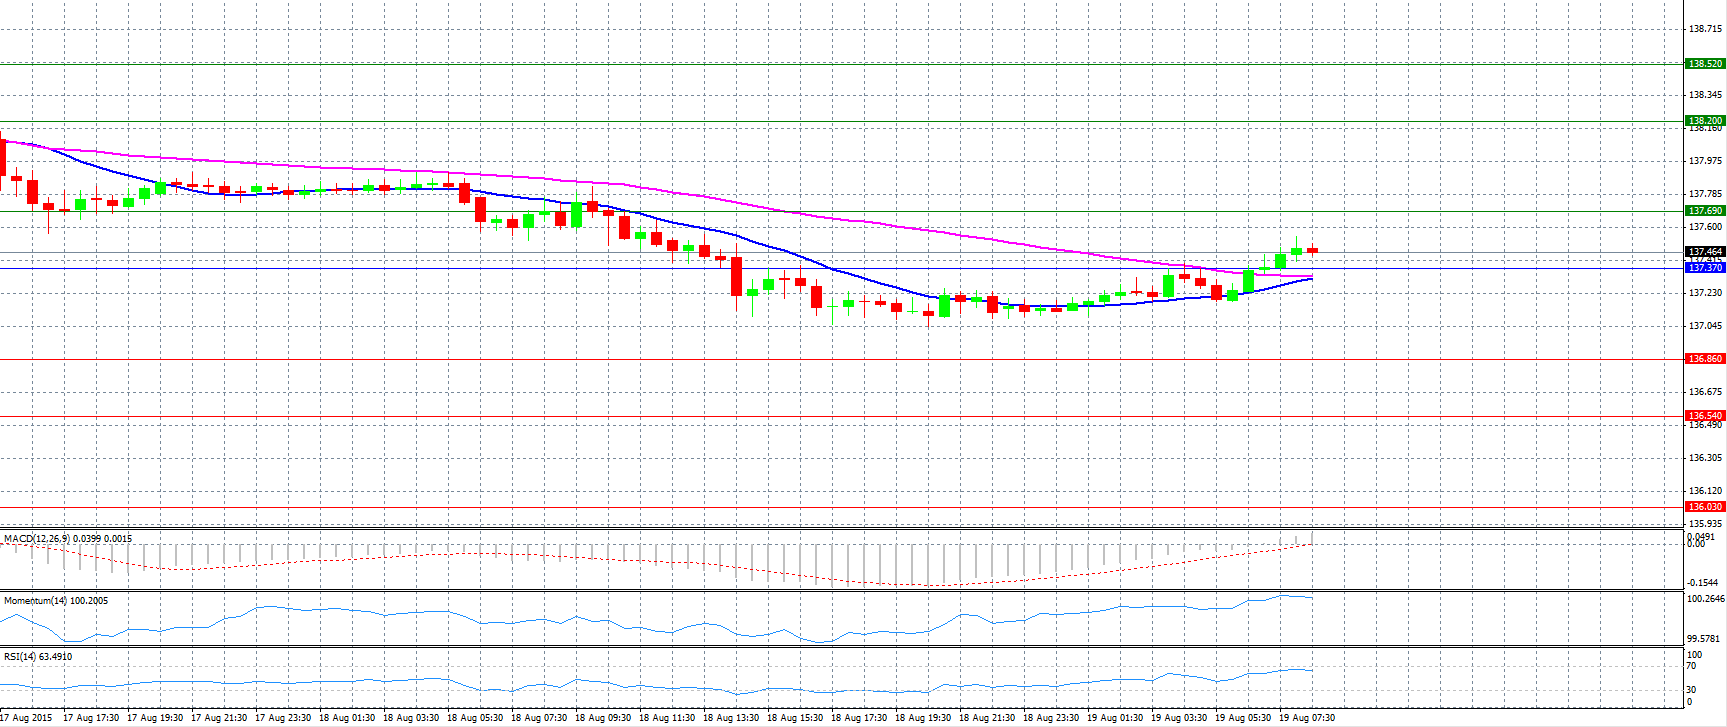
Market Scenario 1: Long positions above 137.37 with targets at 137.69 and 138.20.
Market Scenario 2: Short positions below 137.37 with targets at 136.86 and 136.54.
Comment: The pair strengthened and surpassed pivot point 137.37.
Supports and Resistances:
R3 138.52
R2 138.20
R1 137.69
PP 137.37
S1 136.86
S2 136.54
S3 136.03
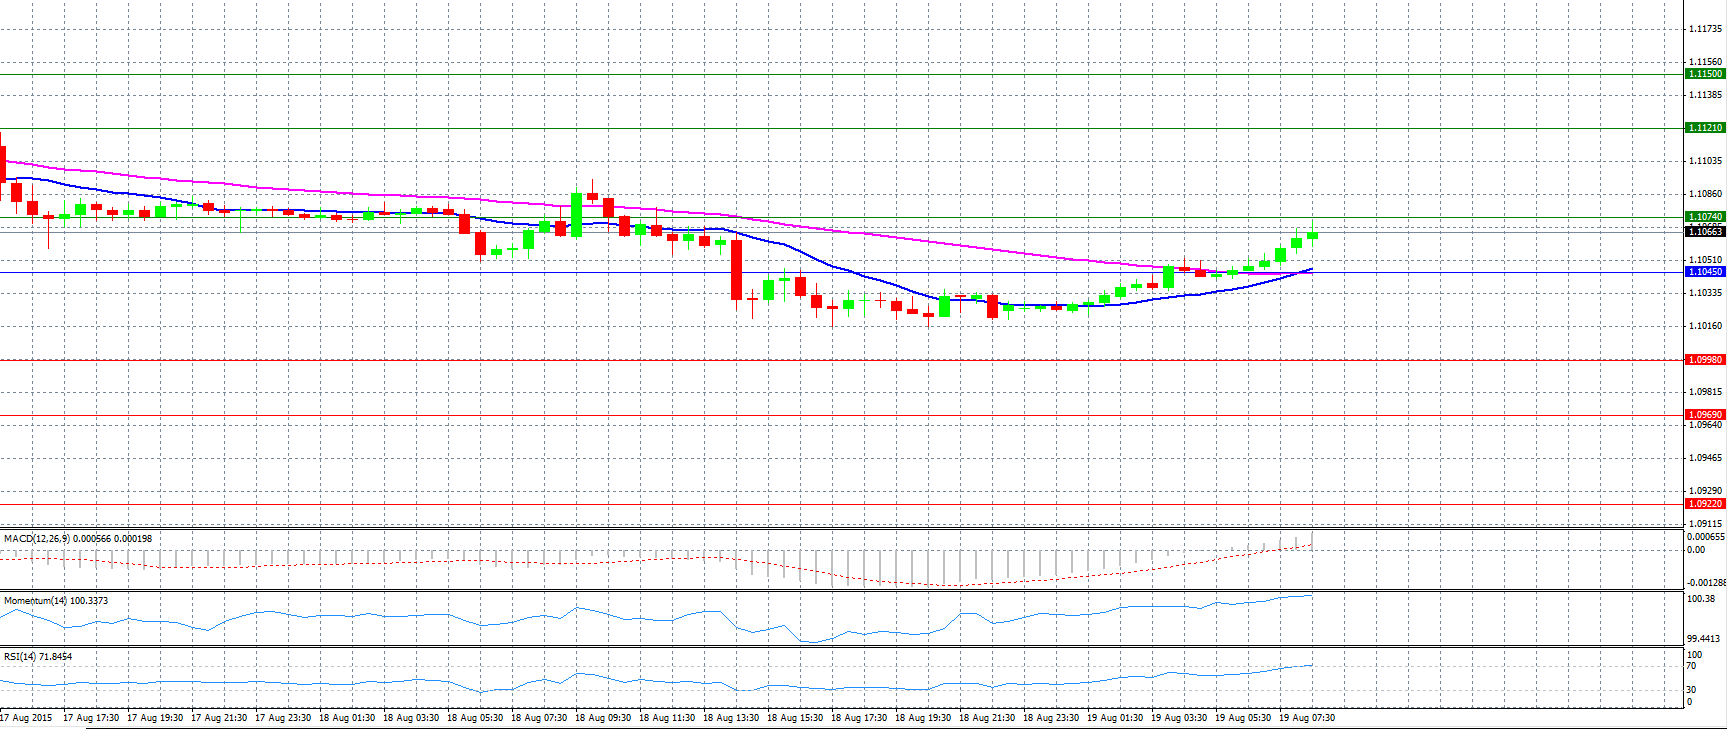
Market Scenario 1: Long positions above 1.1045 with targets at 1.1074 and 1.1121.
Market Scenario 2: Short positions below 1.1045 with targets at 1.0998 and 1.0969.
Comment: The pair advanced and tries to reach resistance level 1.1074.
Supports and Resistances:
R3 1.1150
R2 1.1121
R1 1.1074
PP 1.1045
S1 1.0998
S2 1.0969
S3 1.0922
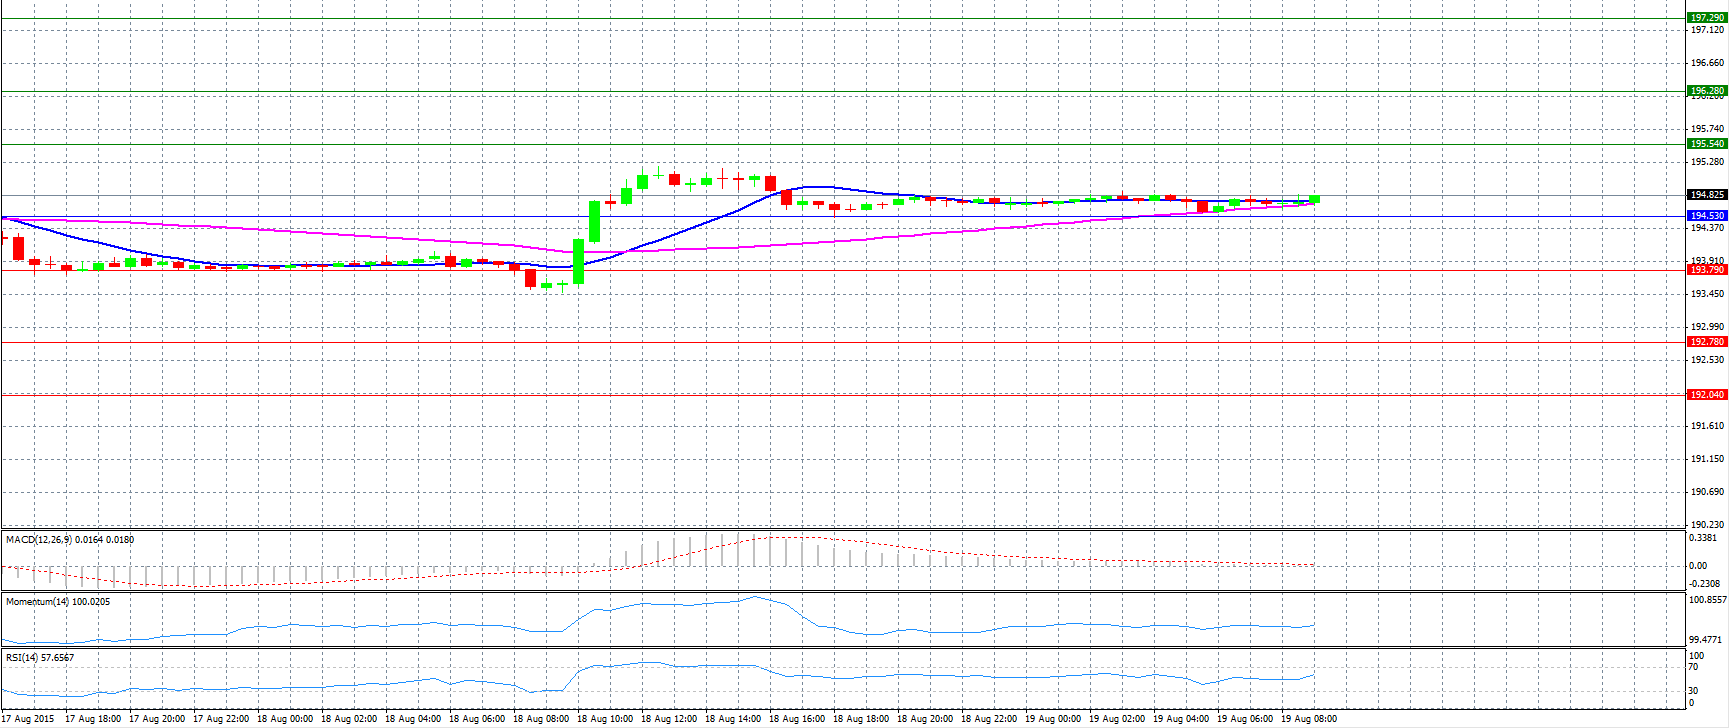
Market Scenario 1: Long positions above 194.53 with targets at 195.54 and 196.28.
Market Scenario 2: Short positions below 194.53 with targets at 193.79 and 192.78.
Comment: The pair trades neutral near 194.80 level.
Supports and Resistances:
R3 197.29
R2 196.28
R1 195.54
PP 194.53
S1 193.79
S2 192.78
S3 192.04
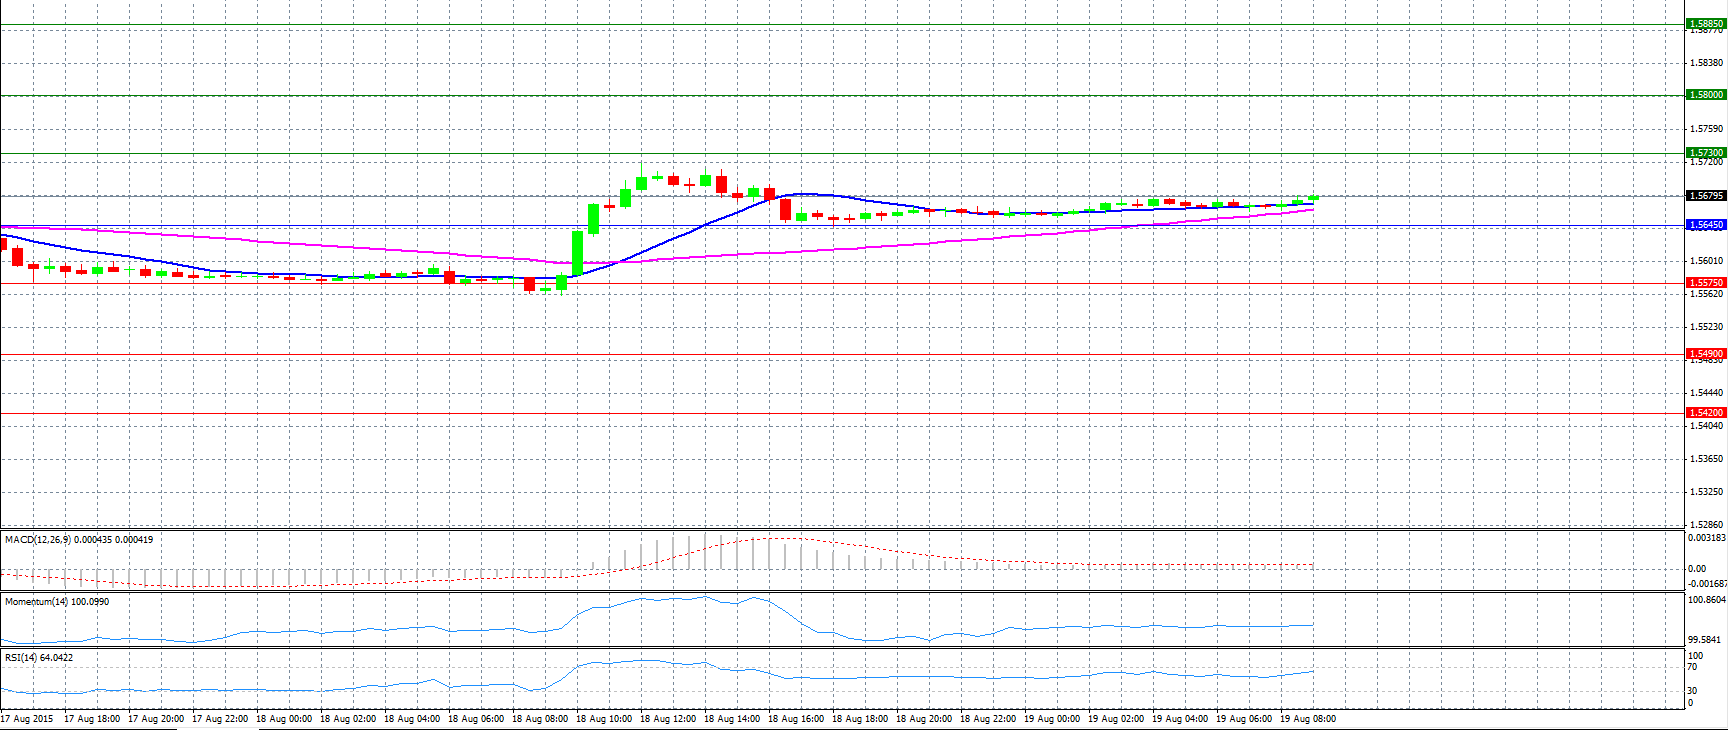
Market Scenario 1: Long positions above 1.5645 with targets at 1.5730 and 1.5800.
Market Scenario 2: Short positions below 1.5645 with targets at 1.5575 and 1.5490.
Comment: The pair hovers around 1.5680 level.
Supports and Resistances:
R3 1.5885
R2 1.5800
R1 1.5730
PP 1.5645
S1 1.5575
S2 1.5490
S3 1.5420
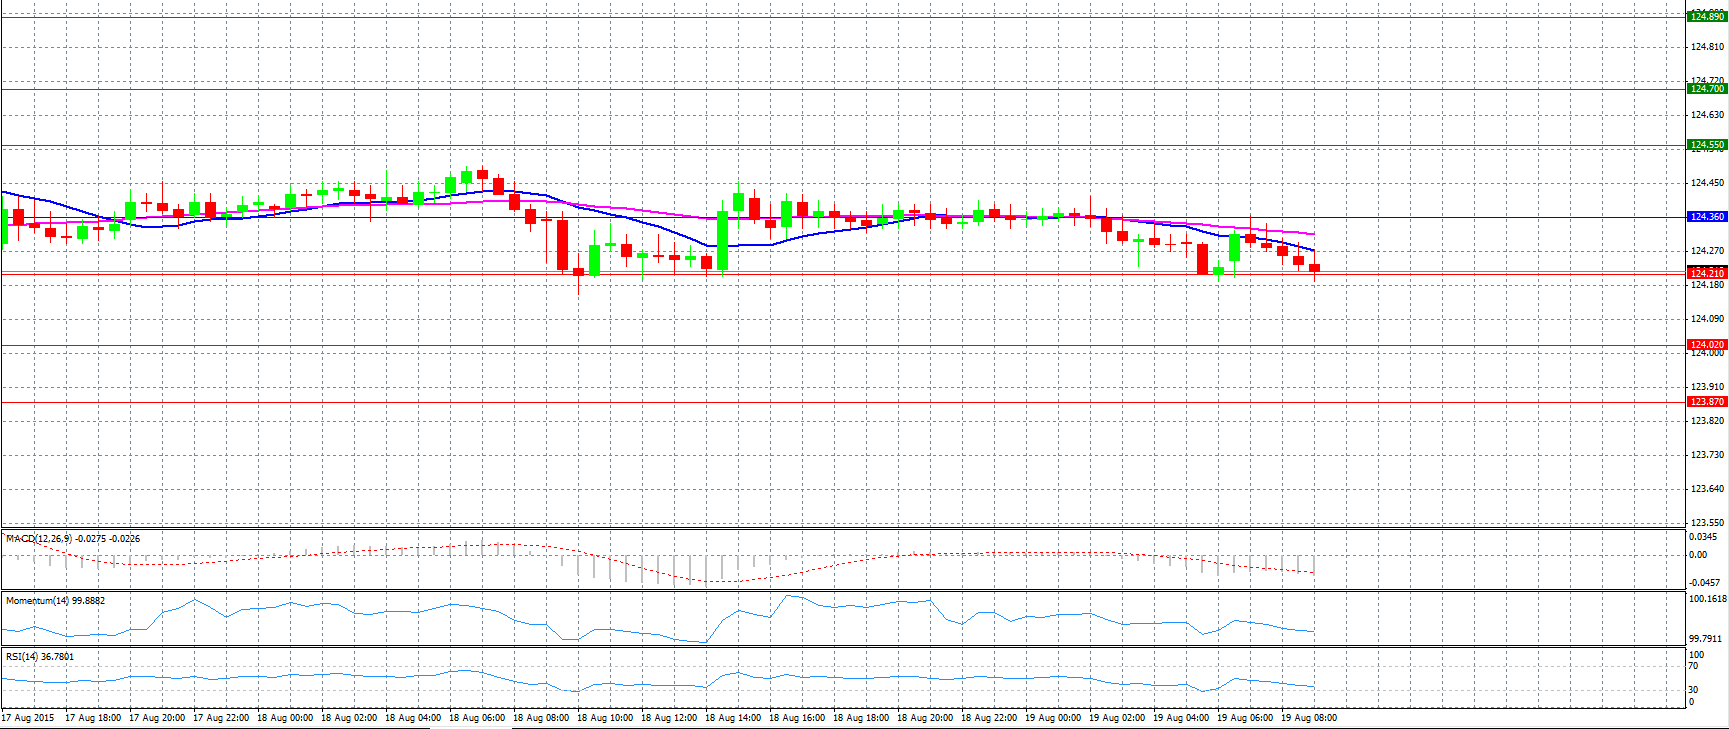
Market Scenario 1: Long positions above 124.36 with targets at 124.55 and 124.70.
Market Scenario 2: Short positions below 124.36 with targets at 124.21 and 124.02.
Comment: The pair is pushed downwards, but it is well supported at 124.21 level.
Supports and Resistances:
R3 124.89
R2 124.70
R1 124.55
PP 124.36
S1 124.21
S2 124.02
S3 123.87
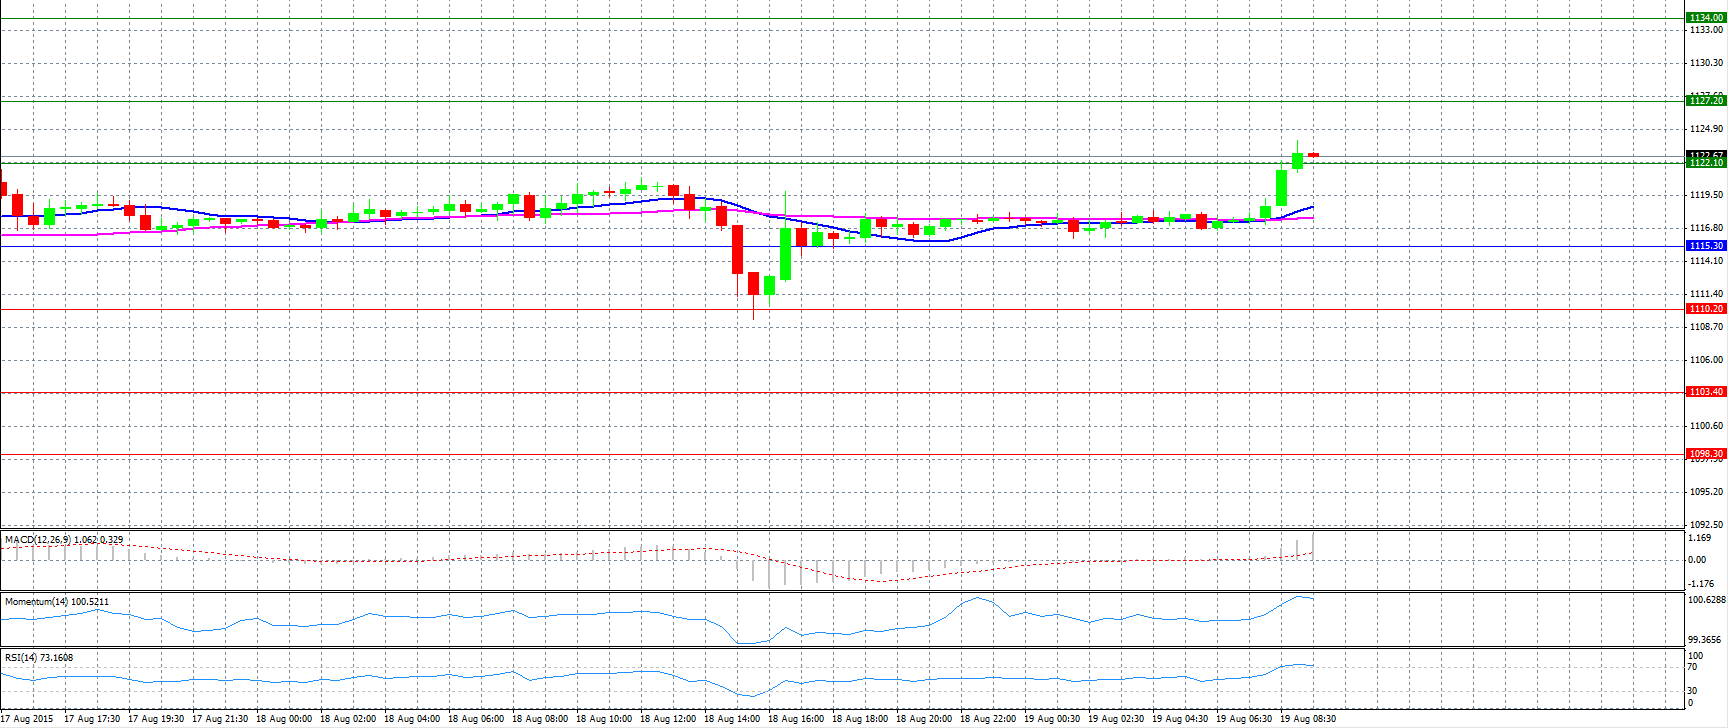
Market Scenario 1: Long positions above 1115.30 with targets at 1122.10 and 1127.20.
Market Scenario 2: Short positions below 1115.30 with targets at 1110.20 and 1103.40.
Comment: Gold prices jumped above resistance level 1122.10 ahead of Fed minutes, U.S. inflation data.
Supports and Resistances:
R3 1134.00
R2 1127.20
R1 1122.10
PP 1115.30
S1 1110.20
S2 1103.40
S3 1098.30
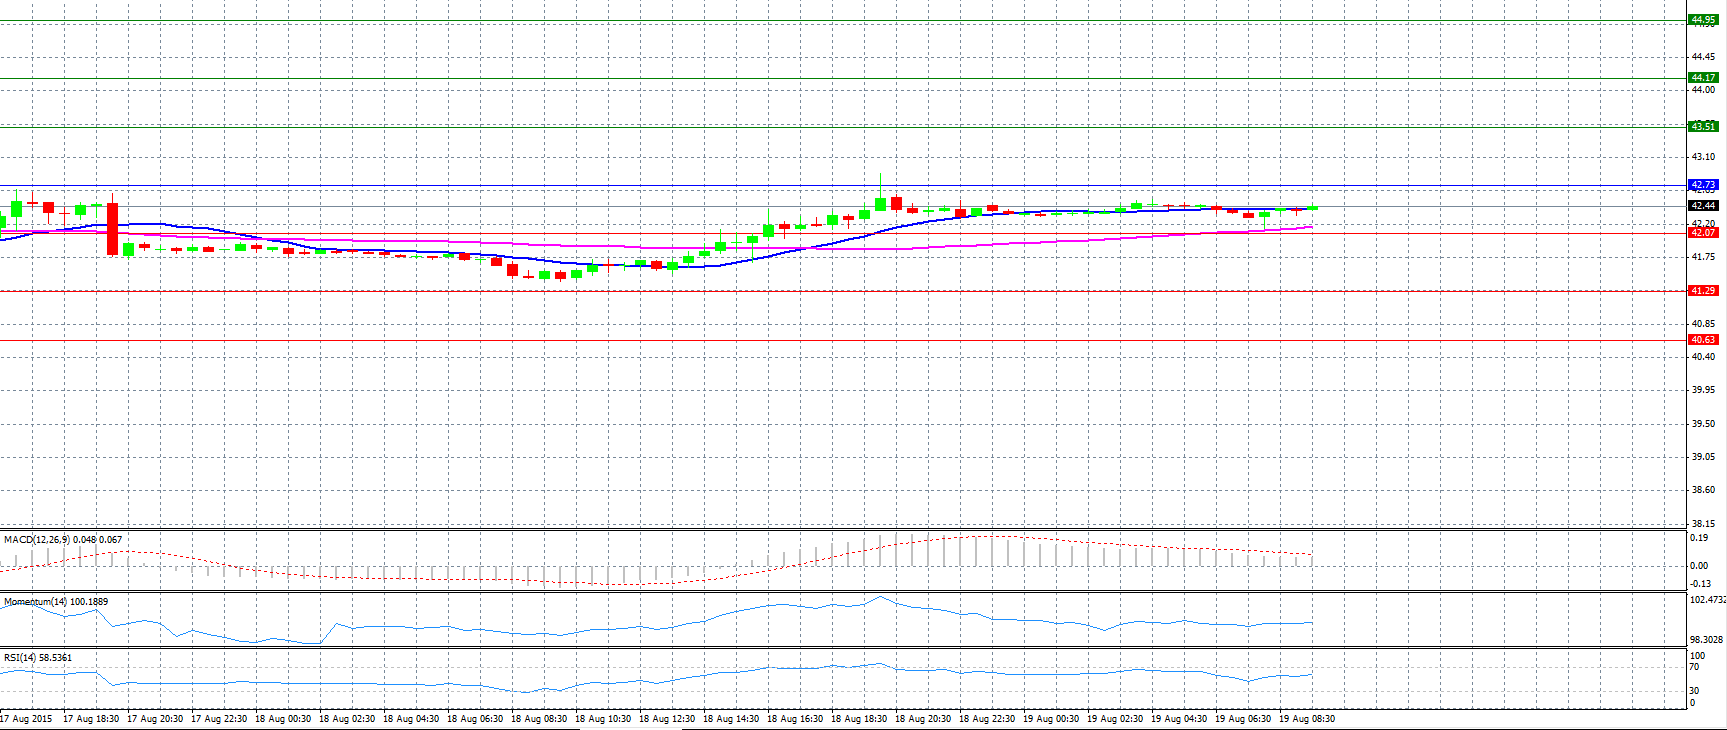
CRUDE OIL
Market Scenario 1: Long positions above 42.73 with targets at 43.51 and 44.17.
Market Scenario 2: Short positions below 42.73 with targets at 42.07 and 41.29.
Comment: Crude oil prices trade unchanged near 42.40 level.
Supports and Resistances:
R3 44.95
R2 44.17
R1 43.51
PP 42.73
S1 42.07
S2 41.29
S3 40.63
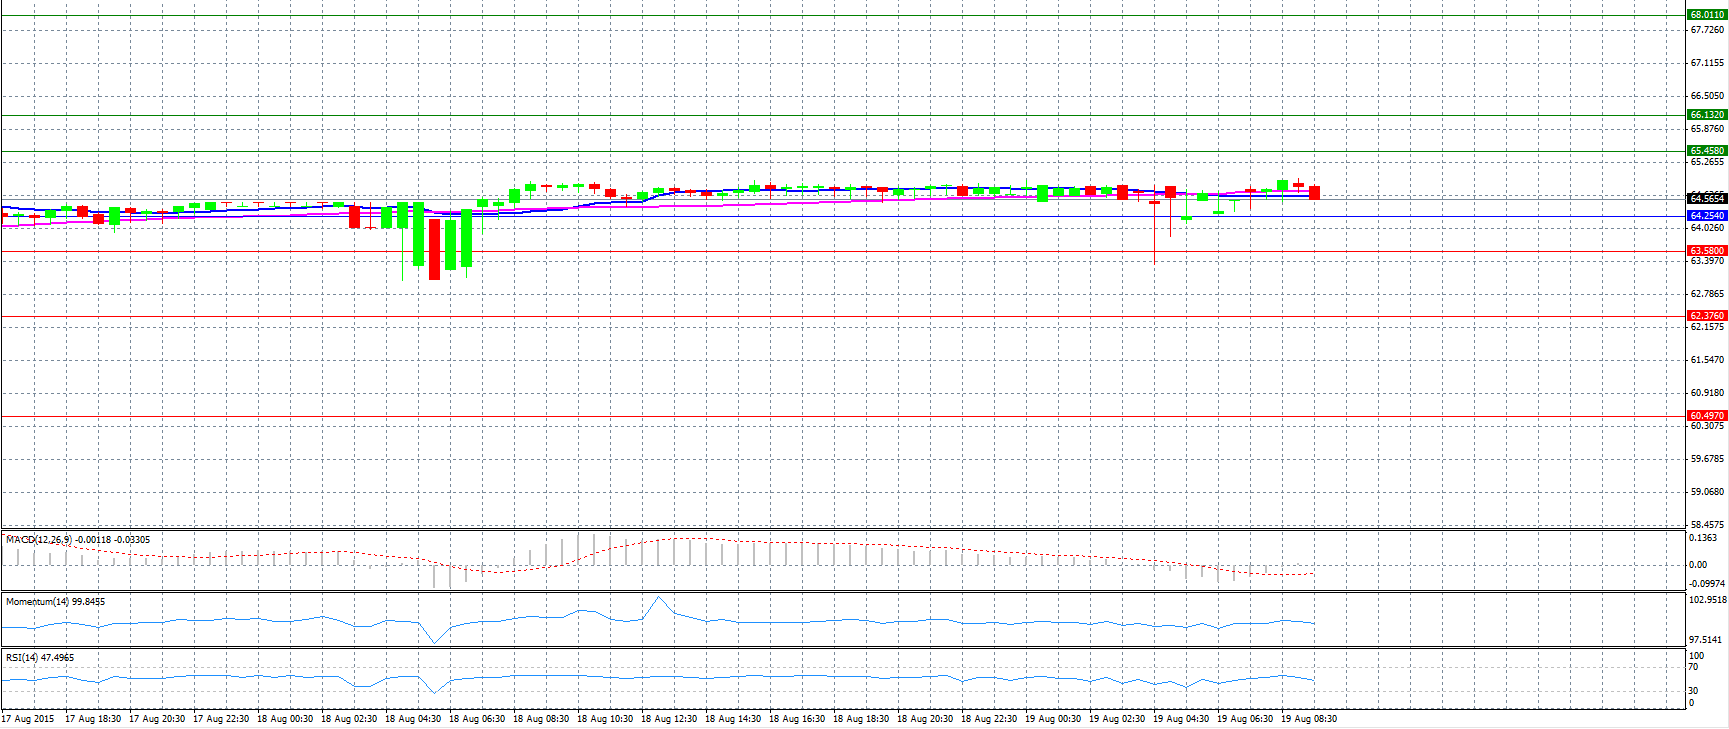
Market Scenario 1: Long positions above 64.254 with targets at 65.458 and 66.132.
Market Scenario 2: Short positions below 64.254 with targets at 63.580 and 62.376.
Comment: The pair trades neutral above pivot point 64.254.
Supports and Resistances:
R3 68.011
R2 66.132
R1 65.458
PP 64.254
S1 63.580
S2 62.376
S3 60.497
