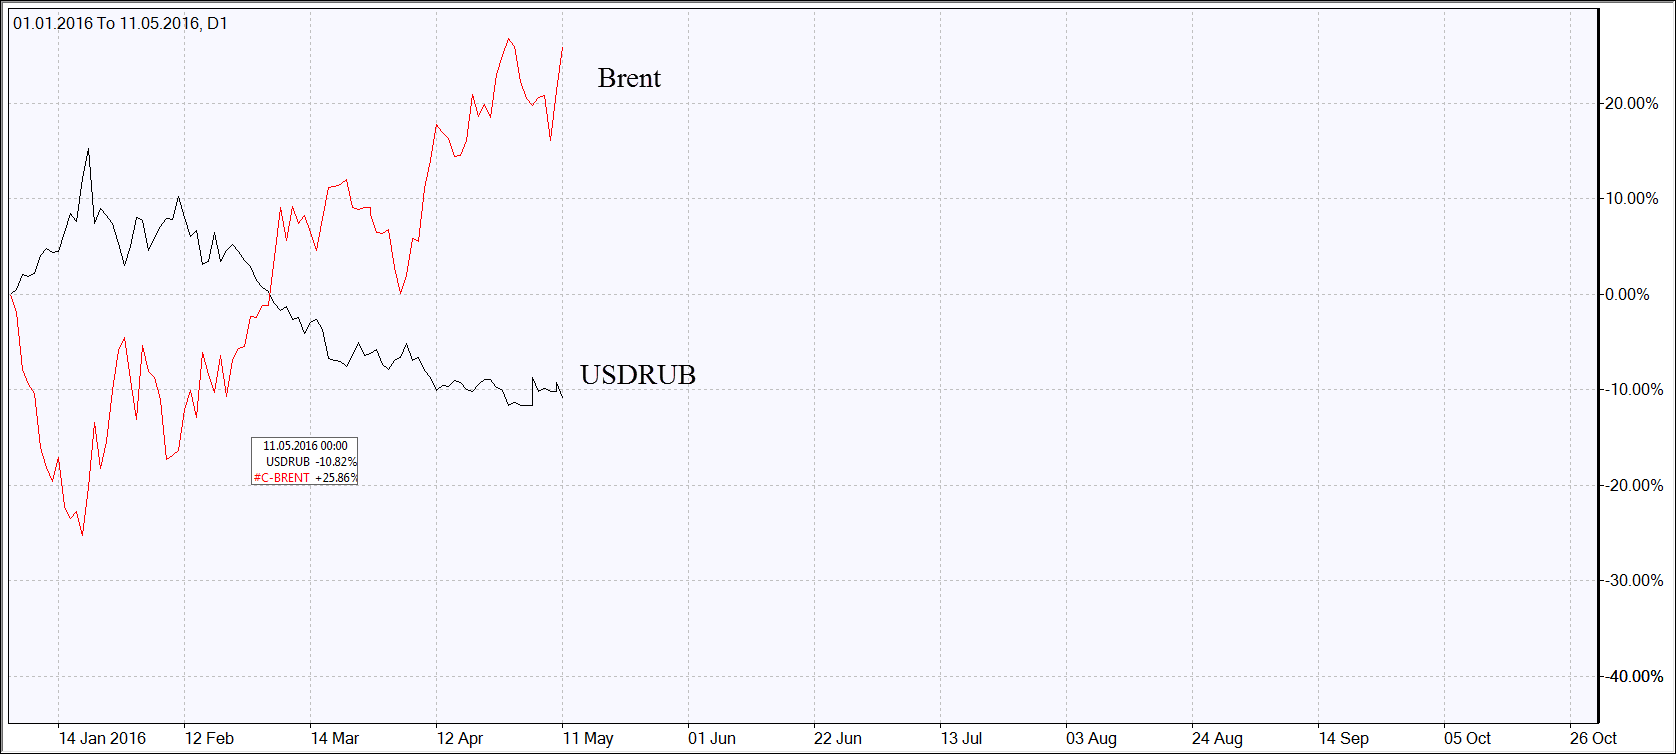
Russian currency price movements differ a lot from the global oil price dynamics. Since the start of the year, the US dollar expressed in Russian ruble fell 10.8%, while Brent oil prices sky-rocketed by 25.8%.
Amid this, the strong growth of Brent/Ruble personal composite instrument (PCI) is observed. As a rule, ruble and oil prices move together. Shall we expect the Brent/Ruble correction?
In general, ruble advances more slowly than oil does. In our opinion, there may be two reasons for that.
The share of fuel and energy in Russia’s exports to far-abroad countries fell to 61% in Q1 2016 from 67.9% in January-March last year. The total value of fuel and energy fell in Q1 2016 by 39.3% while the physical demand fell 0.8%. With rising oil prices, the share of fuel and energy in Russia’s exports may increase again. In theory, this will make the ruble more dependent on Brent oil prices.
The Russian economy is not showing the signs of recovery yet. Russia’s GDP fell 1.8% in March while industrial production fell 0.5%.
The second factor is that Russian monetary authorities limit ruble strengthening in order to raise the competitiveness of locally produced goods and to fight budget deficit. In particular, the Central Bank of Russia raised the foreign exchange reserves by 6% to $390.1bn since the start of the year.


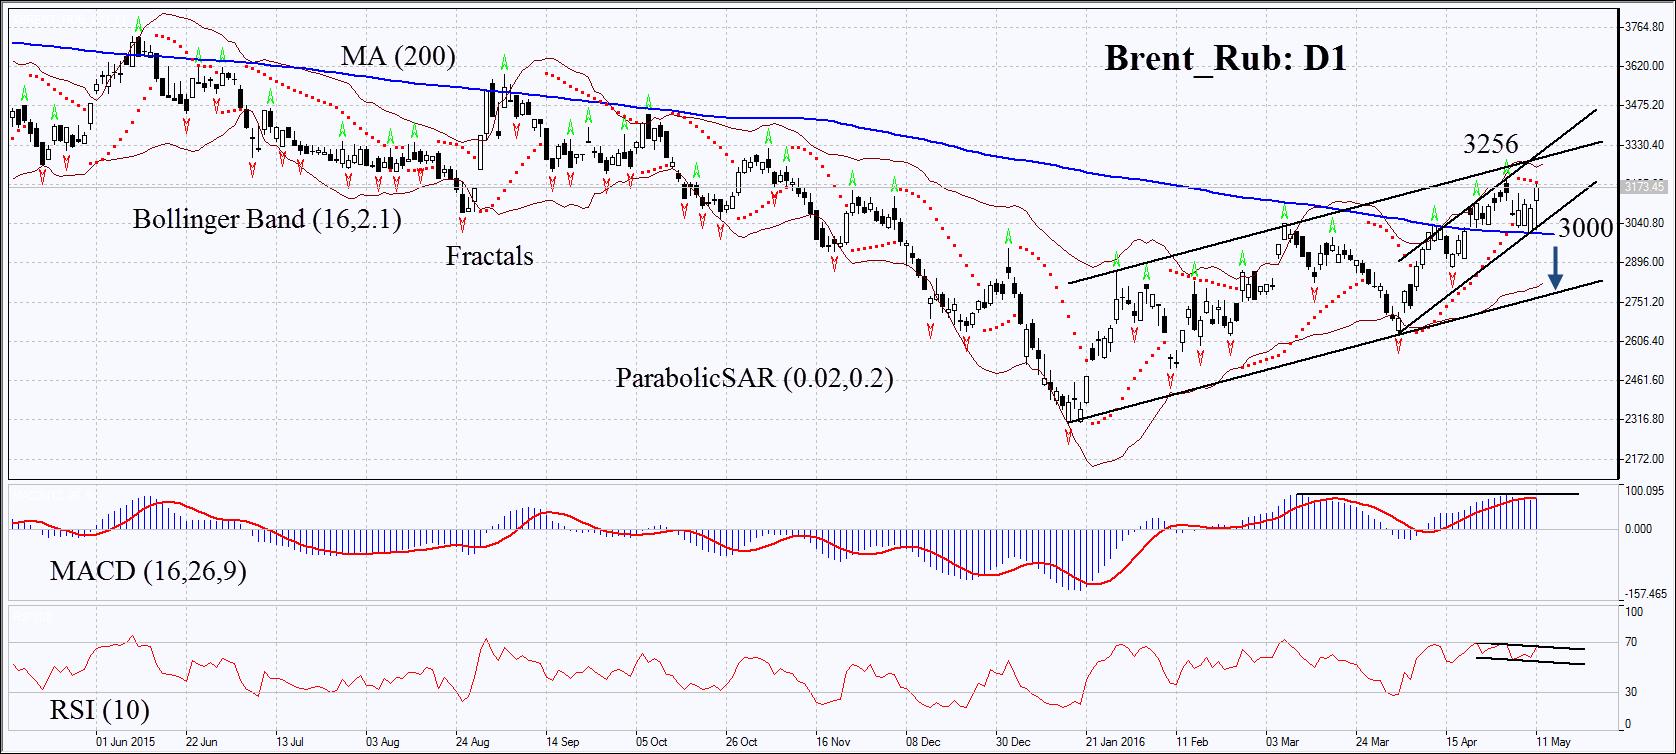
On the daily chart Brent_Rub: D1 has approached the upper boundary of the rising channel. The MACD and parabolic indicators give signals to sell. The RSI has formed the negative divergence. The Bollinger bands have widened, which means higher volatility.
The bearish momentum may develop in case the personal composite instrument falls below its 200-day moving average at 3000. This level may serve the point of entry. The initial risk-limit may be placed above the resistance of the uptrend, the Parabolic signal, the last fractal high and the Bollinger band at 3256.
Having opened the pending order, we shall move the stop to the next fractal high following the parabolic and Bollinger signals. Thus, we are changing the probable profit/loss ratio to the breakeven point. The most risk-averse traders may switch to the 4-hour chart after the trade and place a stop-loss there, moving it in the direction of the trade.
If the price meets the stop-loss level at 3256 without reaching the order at 3000, we recommend cancelling the position: the market sustains internal changes which were not taken into account.
Position: Sell
Sell stop: Below 3000
Stop loss: Above 3256
