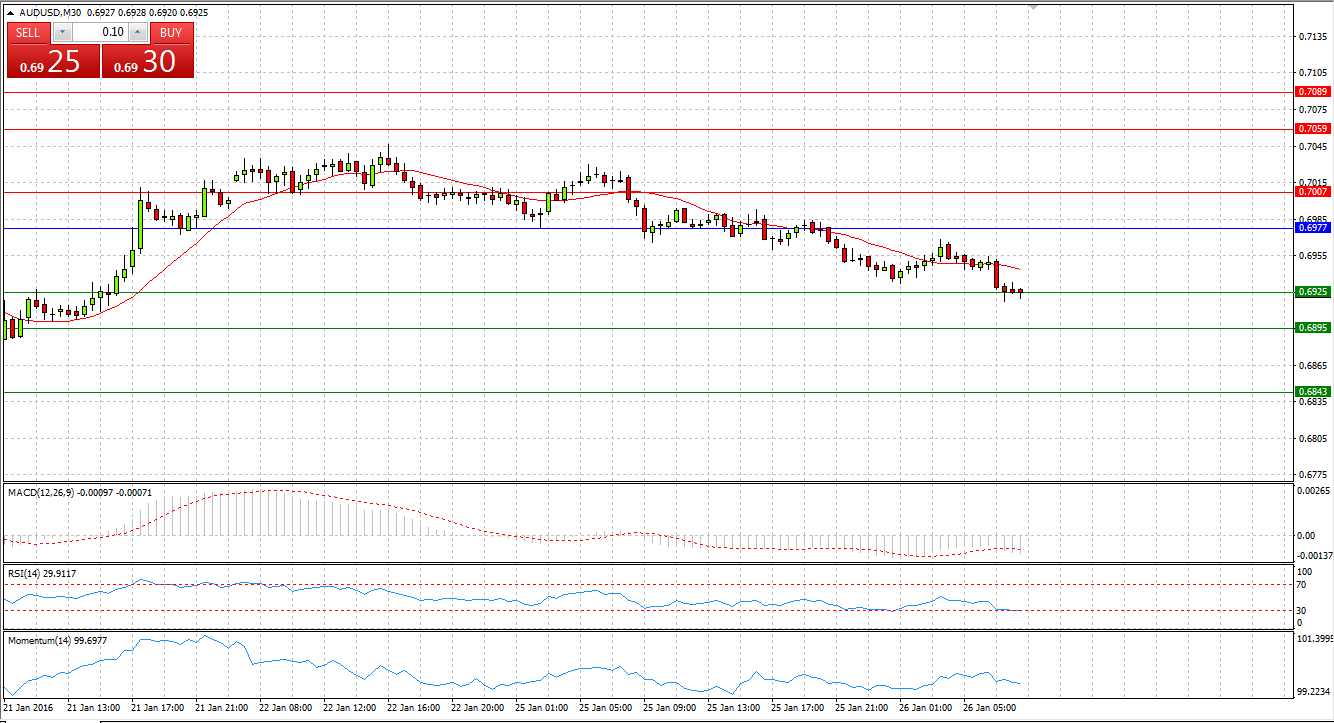
Market Scenario 1: Long positions above 0.6977 with targets at 0.7007 and 0.7059
Market Scenario 2: Short positions below 0.6977 with targets at 0.6925 and 0.6895
Comment: Since Aussie came under selling pressure on Friday 22nd January, after a 2-day long rally, it continues depreciating against the US dollar. During yesterday’s session Aussie lost as much as 100 pips, and today it's already testing the First Support level.
Supports and Resistances:
R3 0.7089
R2 0.7059
R1 0.7007
PP 0.6977
S1 0.6925
S2 0.6895
S3 0.6843
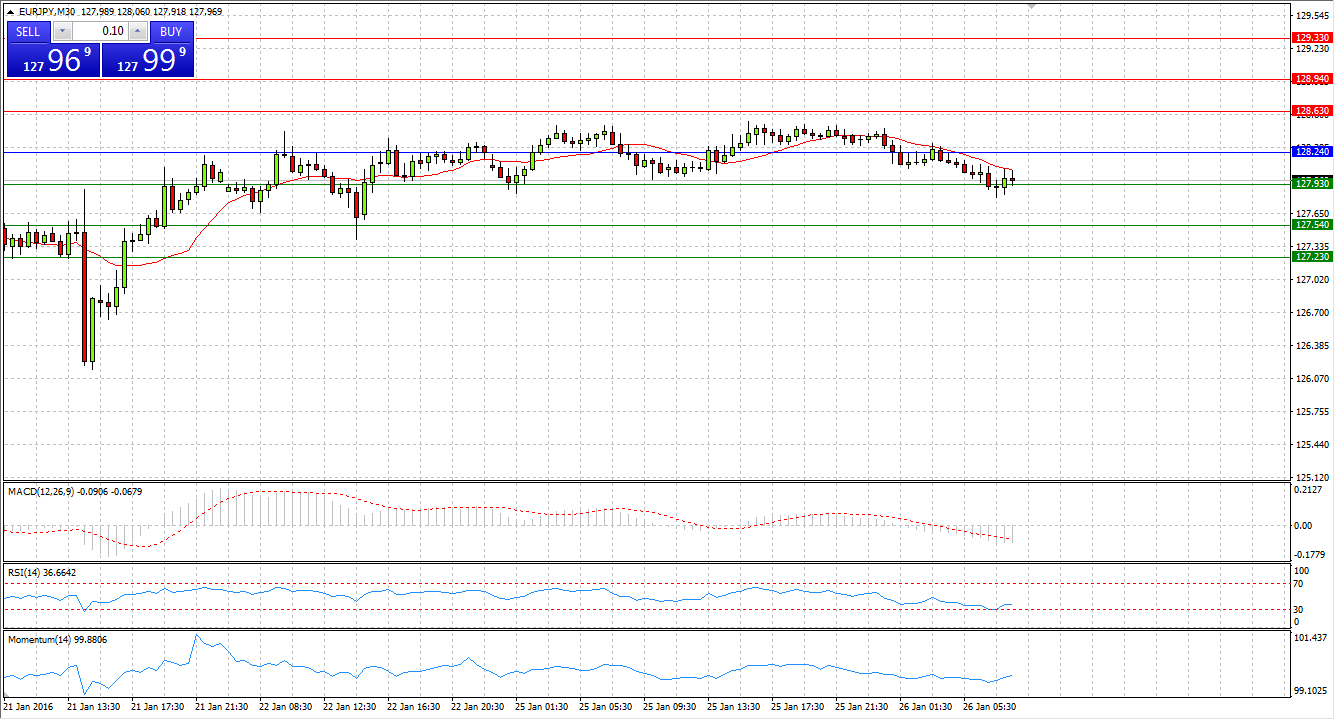
Market Scenario 1: Long positions above 128.24 with targets at 128.63 and 128.94
Market Scenario 2: Short positions below 128.24 with targets at 127.93 and 127.54
Comment: European currency recorded 4th day in a row of consecutive gains against Japanese yen on yesterday’s session. Nonetheless today the pair came under pressure and was sent below Pivot Point level and is currently testing the First Resistance level.
Supports and Resistances:
R3 129.33
R2 128.94
R1 128.63
PP 128.24
S1 127.93
S2 127.54
S3 127.23
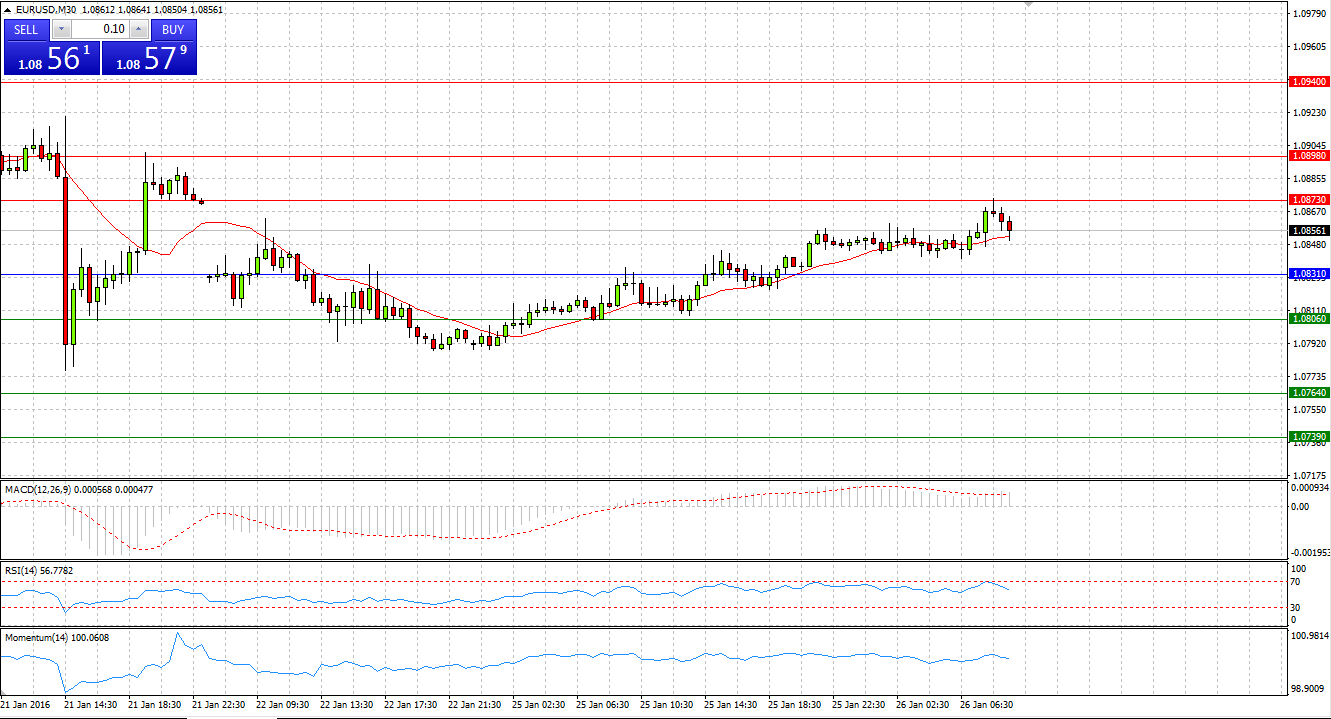
Market Scenario 1: Long positions above 1.0831 with targets at 1.0873 and 1.0898
Market Scenario 2: Short positions below 1.0831 with targets at 1.0806 and 1.0764
Comment: Having closed 3 trading sessions in a row in negative territory, European currency managed to find some solid ground and close yesterday’s session in profit against US dollar. Today EUR/USD continues trading with positive bias close to the First Resistance level.
In profit. Supports and Resistances:
R3 1.0940
R2 1.0898
R1 1.0873
PP 1.0831
S1 1.0806
S2 1.0764
S3 1.0739
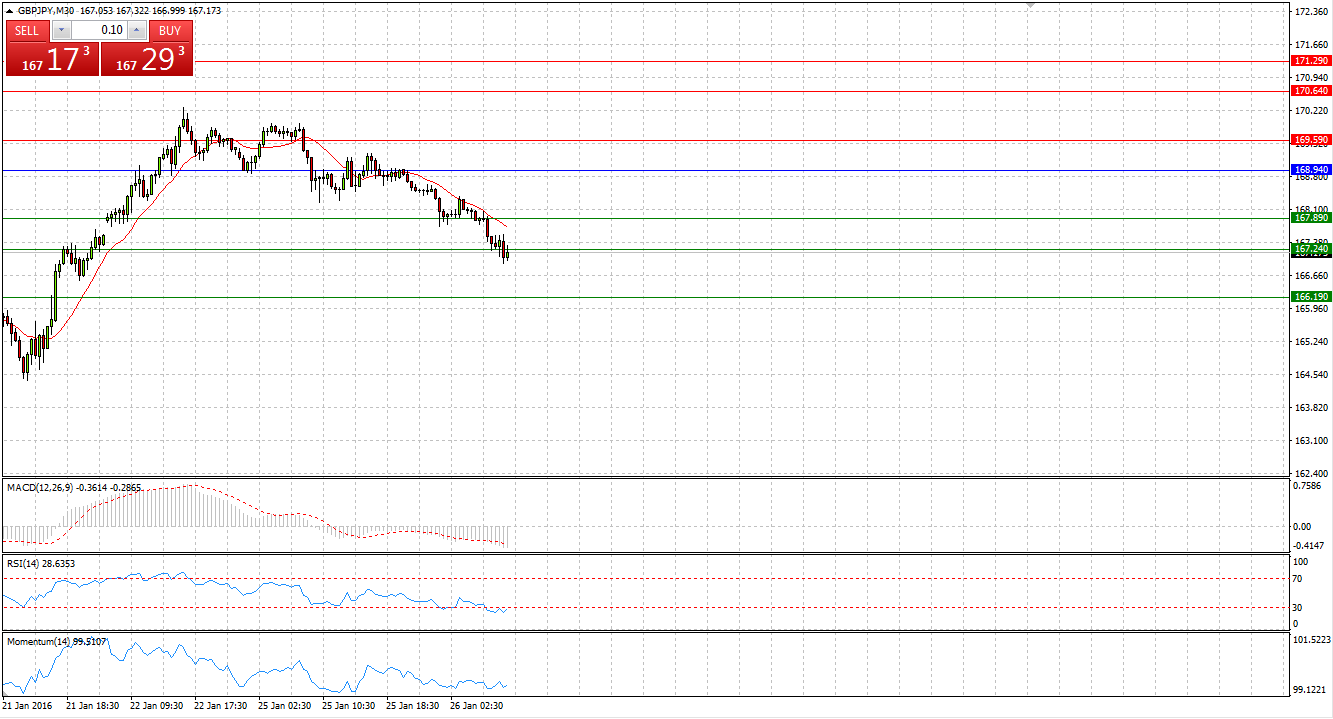
Market Scenario 1: Long positions above 168.94 with targets at 169.59 and 170.64
Market Scenario 2: Short positions below 168.94 with targets at 167.89 and 167.24
Comment: Sterling came under pressure against Japanese yen during yesterday’s session ahead of BOJ Monetary Policy statement on Friday 29th January. Today sterling continues depreciating against yen and has already broken through First and Second Resistance levels.
Supports and Resistances:
R3 171.29
R2 170.64
R1 169.59
PP 168.94
S1 167.89
S2 167.24
S3 166.19
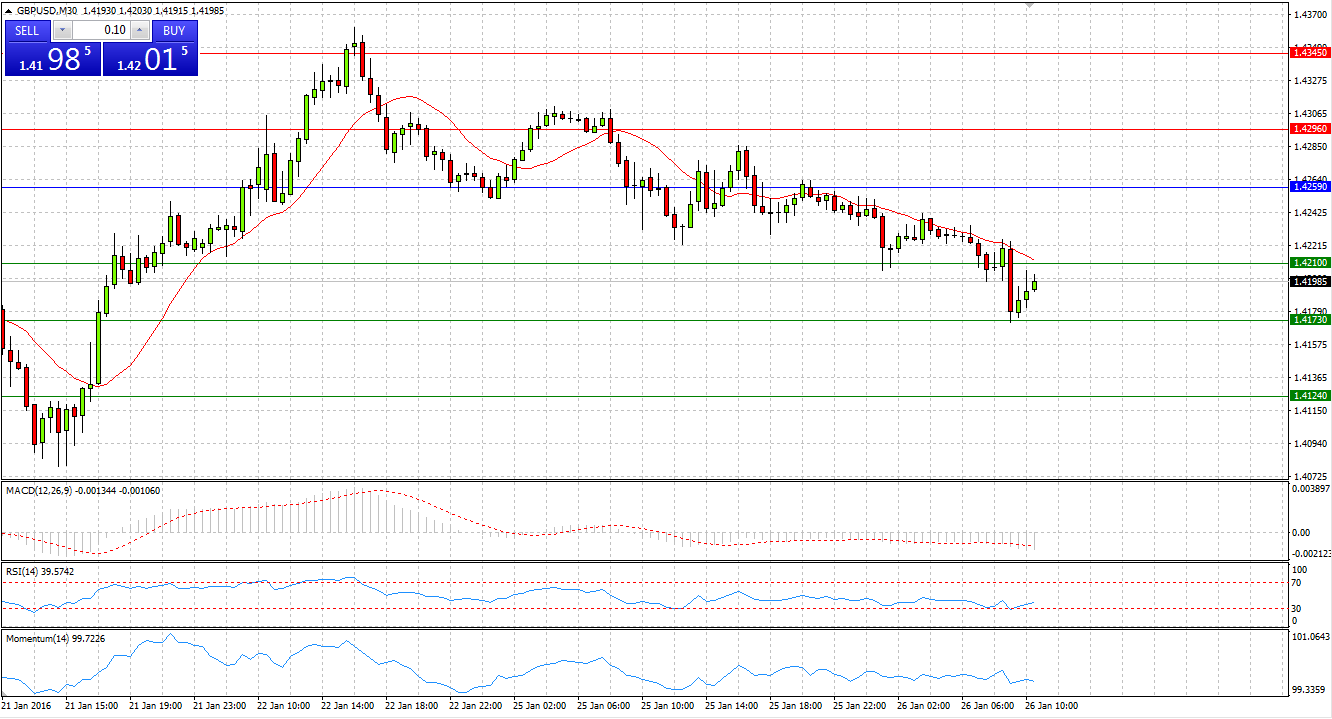
Market Scenario 1: Long positions above 1.4259 with targets at 1.4296 and 1.4345
Market Scenario 2: Short positions below 1.4259 with targets at 1.4210 and 1.4173
Comment: Sterling continues trading under pressure against US dollar, closing yesterday’s session with 25 pips loss. Today the pair dropped even further and has already broken the First Support level aiming to reach the second one.
Supports and Resistances:
R3 1.4382
R2 1.4345
R1 1.4296
PP 1.4259
S1 1.4210
S2 1.4173
S3 1.4124
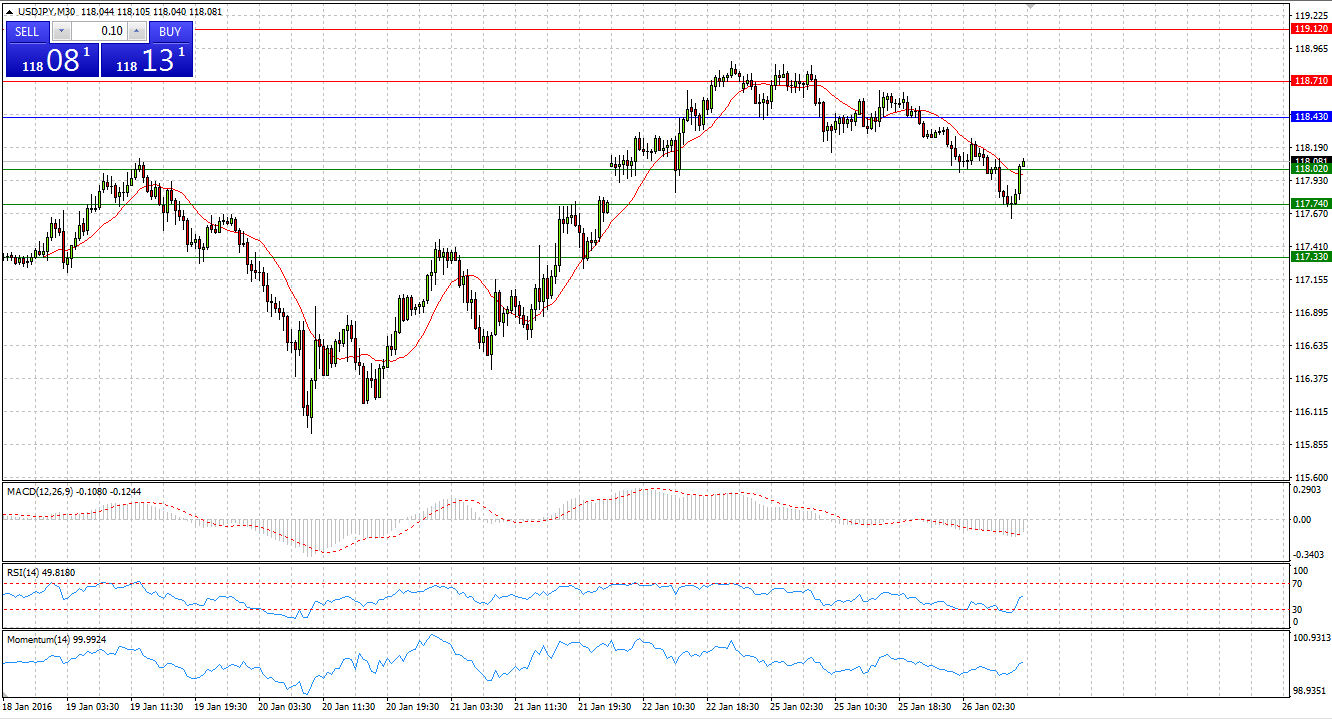
Market Scenario 1: Long positions above 118.43 with targets at 118.71 and 119.12
Market Scenario 2: Short positions below 118.43 with targets at 118.02 and 117.74
Comment: US dollar after 3 consecutive days of gains closed yesterday’s session in negative territory against the Japanese yen. Today the pair continues trading under pressure and has already tested both Support levels, however, being unable to sustain the buying pressure was sent above the First Support level.
Supports and Resistances:
R3 119.40
R2 119.12
R1 118.71
PP 118.43
S1 118.02
S2 117.74
S3 117.33
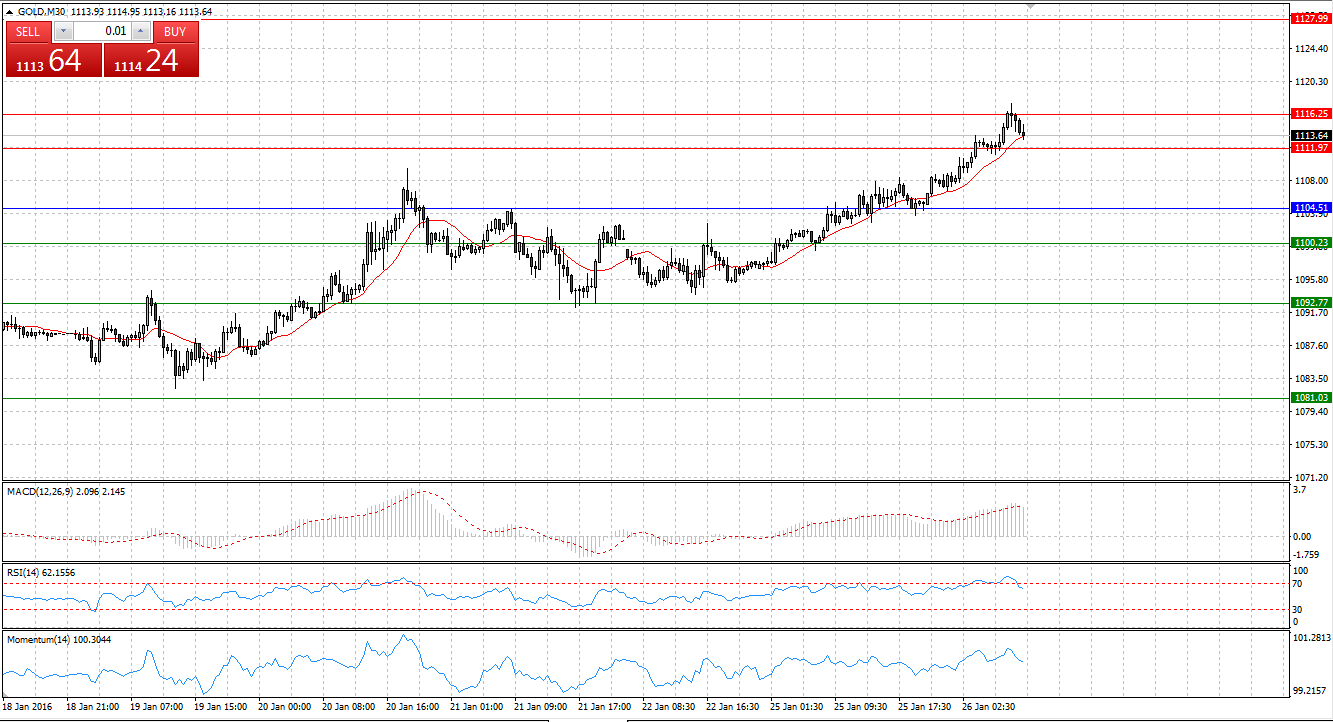
Market Scenario 1: Long positions above 1104.51 with targets at 1111.97 and 1116.25
Market Scenario 2: Short positions below 1104.51 with targets at 1100.23 and 1092.77
Comment: Gold during yesterday’s session rose against US dollar, gaining as much as 10 US dollar per troy ounce. Today bullion continues its upward move, having already broken through its recent high at 1112.82.
Supports and Resistances:
R3 1127.99
R2 1116.25
R1 1111.97
PP 1104.51
S1 1100.23
S2 1092.77
S3 1081.03
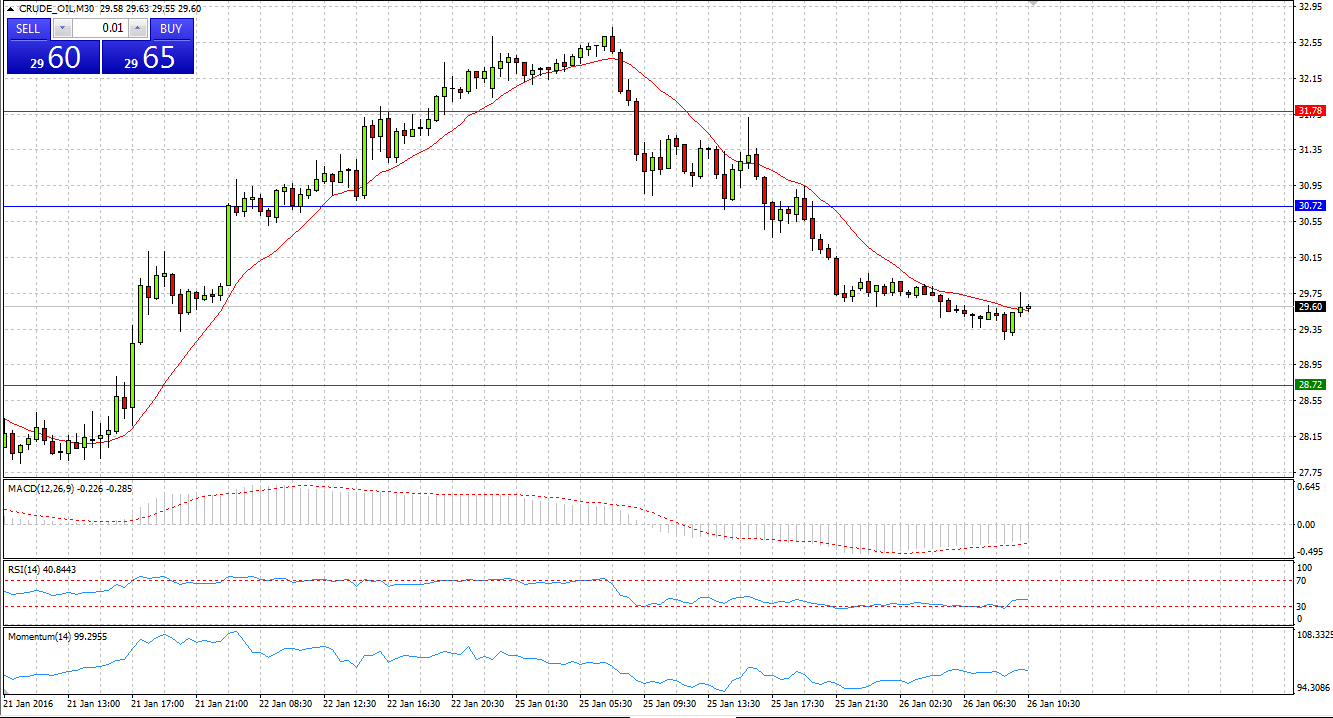
Market Scenario 1: Long positions above 30.72 with targets at 31.78 and 33.78
Market Scenario 2: Short positions below 31.69 with targets at 31.05 and 29.87
Comment: Crude oil during yesterday’s session was drastically sold-off, having taken away all the gains it earned during Friday’s session. Today, crude oil remains under pressure, trading below Pivot Point level.
Supports and Resistances:
R3 36.84
R2 33.78
R1 31.78
PP 30.72
S1 28.72
S2 27.66
S3 24.60
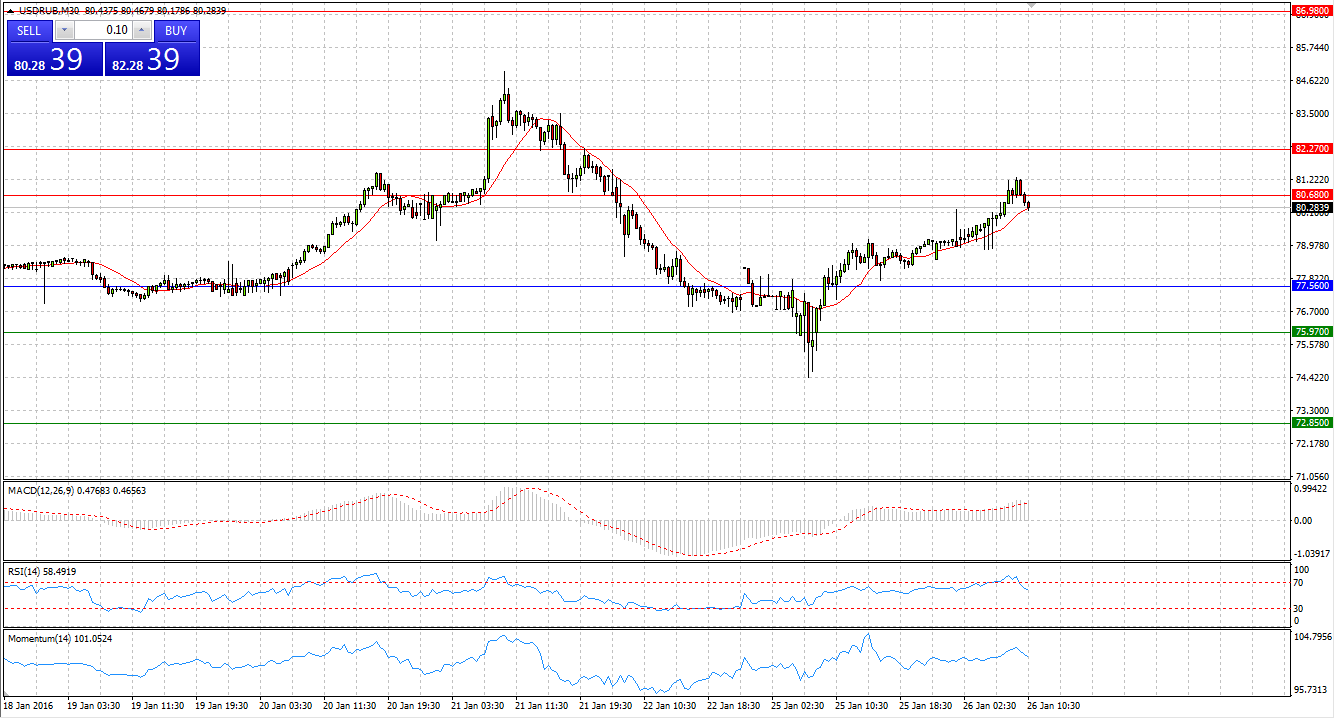
Market Scenario 1: Long positions above 77.56 with targets at 80.68 and 82.27
Market Scenario 2: Short positions below 77.56 with targets at 75.97 and 72.85
Comment: US dollar having reached its lowest level at 74.45 during yesterday’s session against Russian ruble gathered strength and rose, closing the session in positive territory at 79.08. Today the pair continues moving higher amid renewed drop in oil prices.
Supports and Resistances:
R3 86.98
R2 82.27
R1 80.68
PP 77.56
S1 75.97
S2 72.85
S3 68.14
