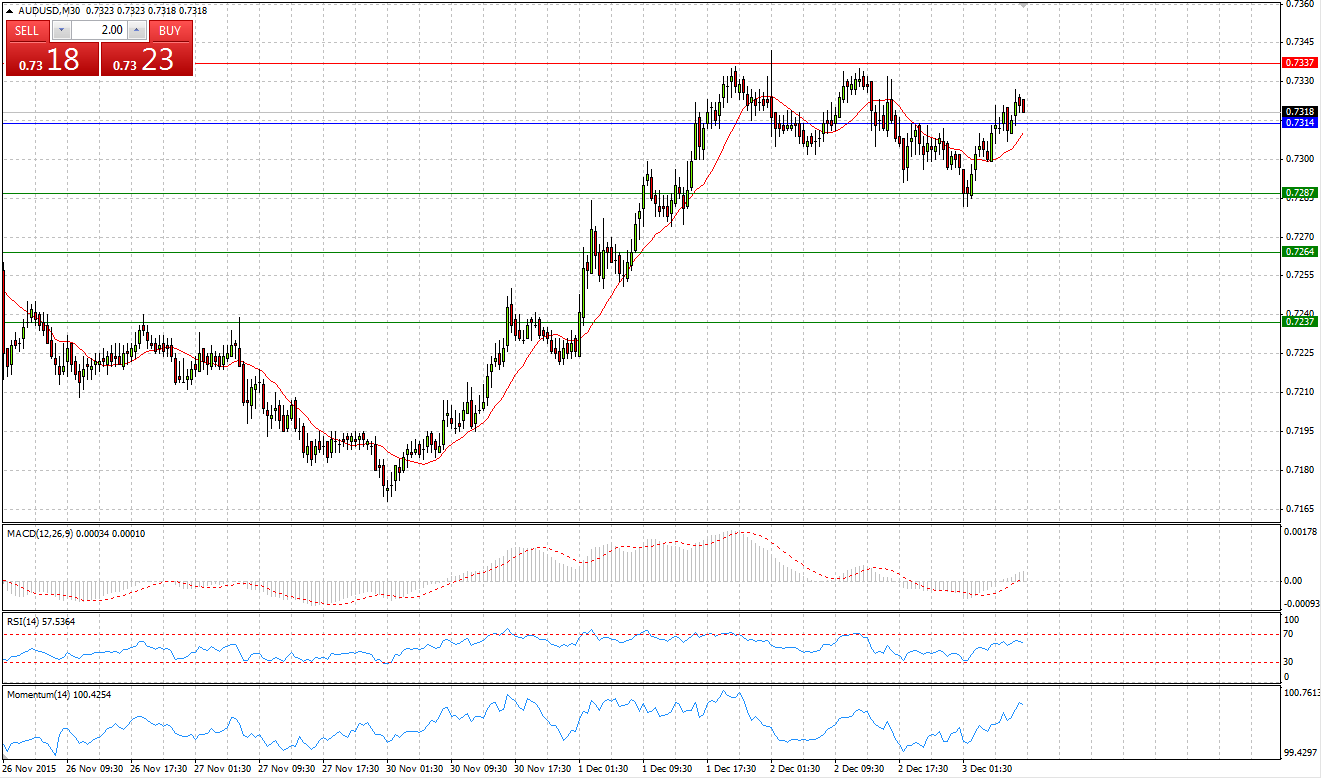
Market Scenario 1: Long positions above 0.7314 with targets at 0.7364 and 0.7337
Market Scenario 2: Short positions below 0.7314 with targets at 0.7287 and 0.7264
Comment: Australian dollar reached a new high at 0.7342 against US dollar during yesterday’s session, however, encountering selling pressure Aussie was pushed back and closed the day in negative territory. Today the pair was sent to 25th on November high, which is close to S1, where it found support and managed to break through Pivot Point level.
Supports and Resistances:
R3 0.7387
R2 0.7364
R1 0.7337
PP 0.7314
S1 0.7287
S2 0.7264
S3 0.7237
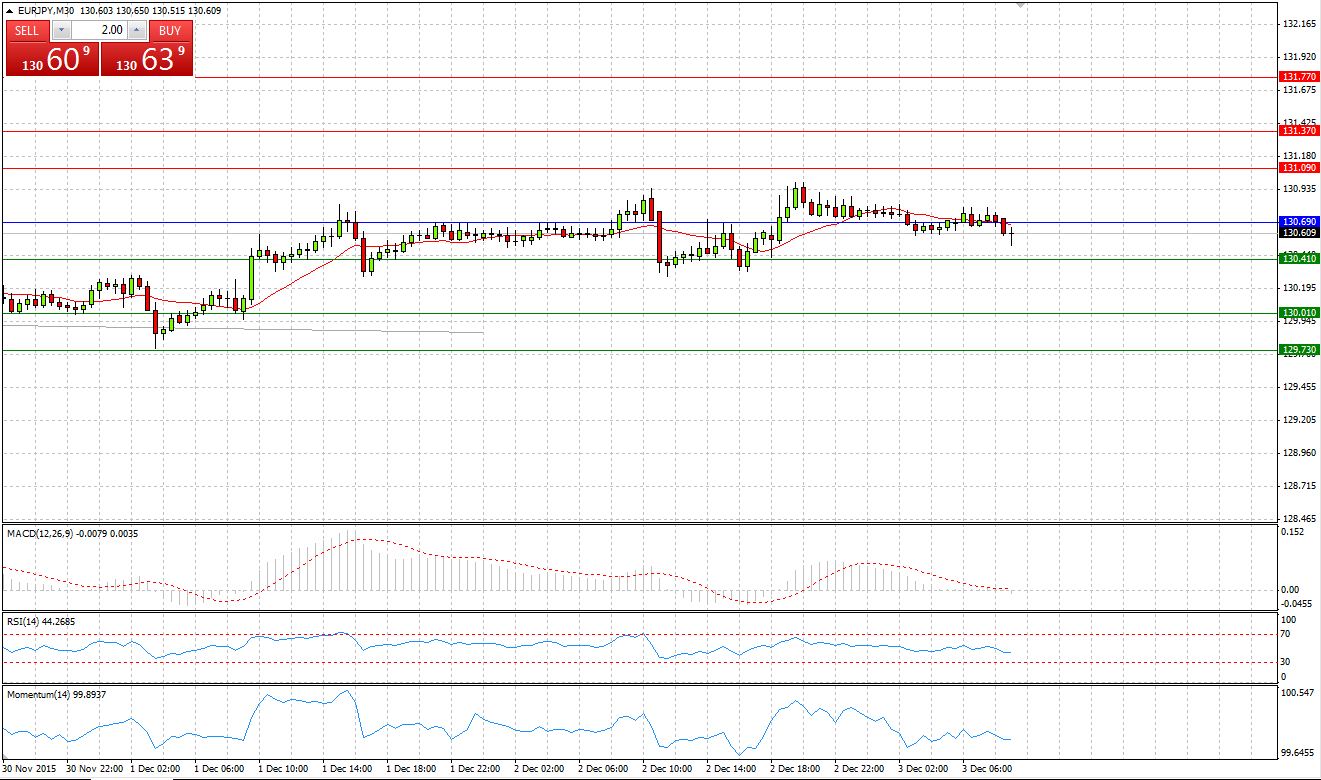
Market Scenario 1: Long positions above 130.39 with targets at 131.04 and 131.44
Market Scenario 2: Short positions below 130.39 with targets at 129.99 and 129.34
Comment: European currency closed a third day in the row in positive territory against Japanese yen, closing yesterday’s session at 130.76. Today the pair is trading close to Pivot Point level ahead of ECB press conference.
Supports and Resistances:
R3 131.77
R2 131.37
R1 131.09
PP 130.69
S1 130.41
S2 130.01
S3 129.73
EUR/USD
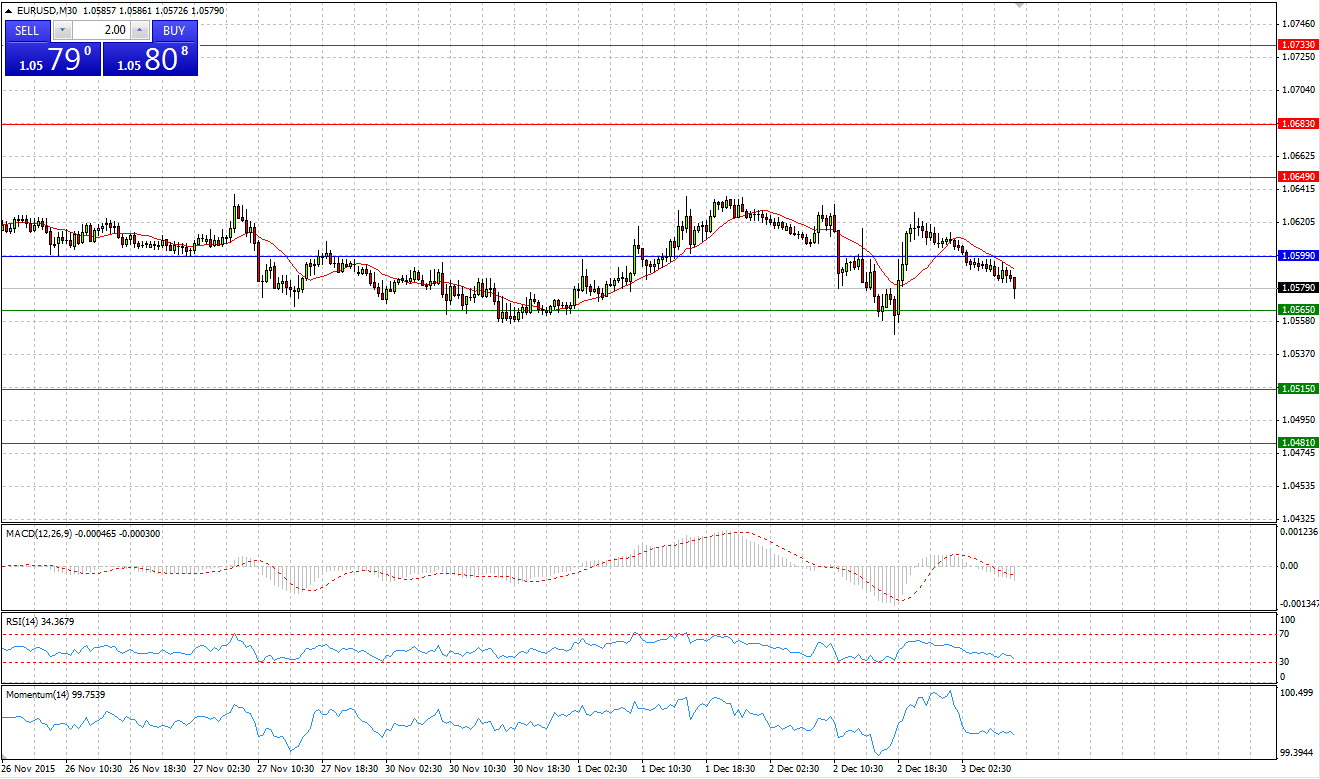
Market Scenario 1: Long positions above 1.0599 with targets at 1.0649 and 1.0683
Market Scenario 2: Short positions below 1.0599 with targets at 1.0565 and 1.0515
Comment: European currency came under selling pressure during yesterday’s session and reached a new low at 1.0549 against US dollar, however, by the end of the day euro managed to take back almost all the losses incurred during the day. Today EUR/USD is trading under pressure ahead of ECB meeting.
Supports and Resistances:
R3 1.0733
R2 1.0683
R1 1.0649
PP 1.0599
S1 1.0565
S2 1.0515
S3 1.0481
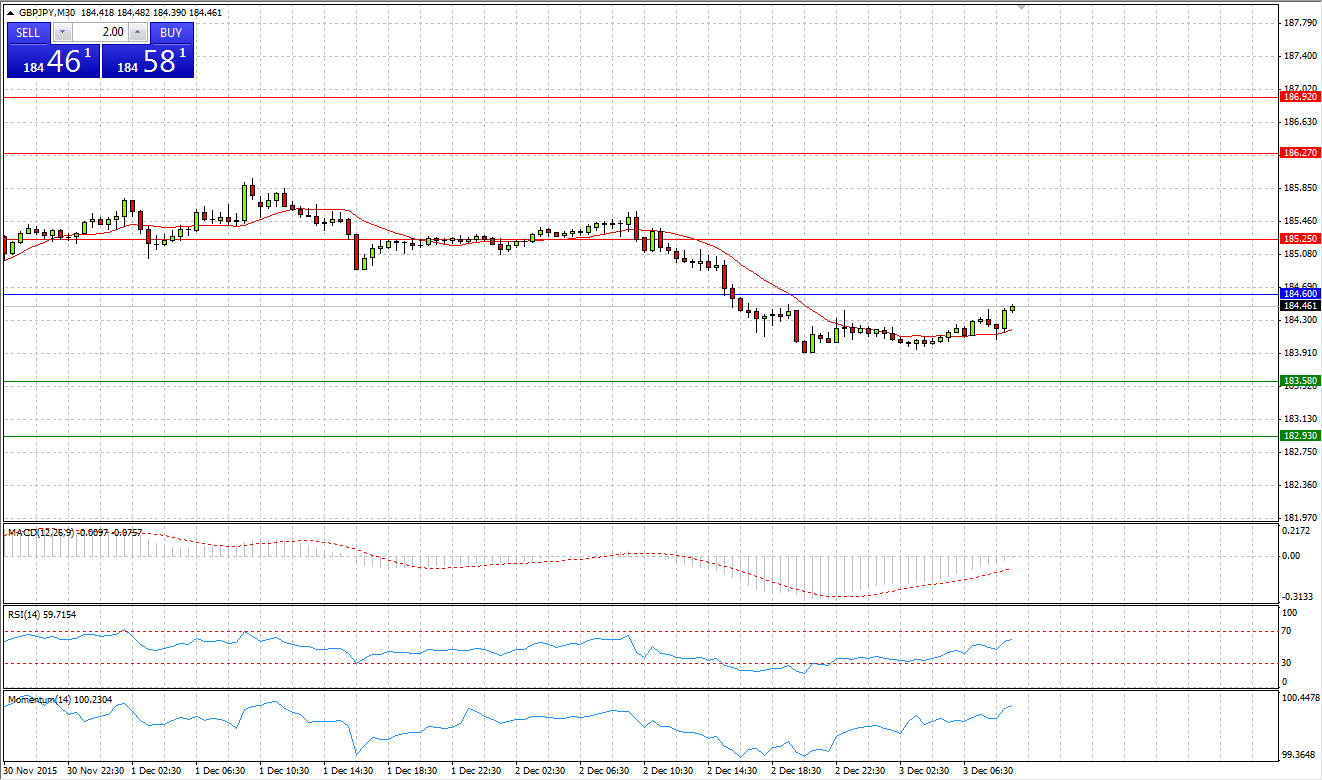
Market Scenario 1: Long positions above 184.60 with targets at 185.25 and 186.27
Market Scenario 2: Short positions below 184.60 with targets at 183.58 and 182.93
Comment: Sterling didn’t sustain the selling pressure and was sent below 184 Japanese yen per GBP during yesterday’s session, however, by the end of the day it managed to close the day slightly above this threshold. Today the pair is trading slightly below Pivot Point level.
Supports and Resistances:
R3 186.92
R2 186.27
R1 185.25
PP 184.60
S1 183.58
S2 182.93
S3 181.91
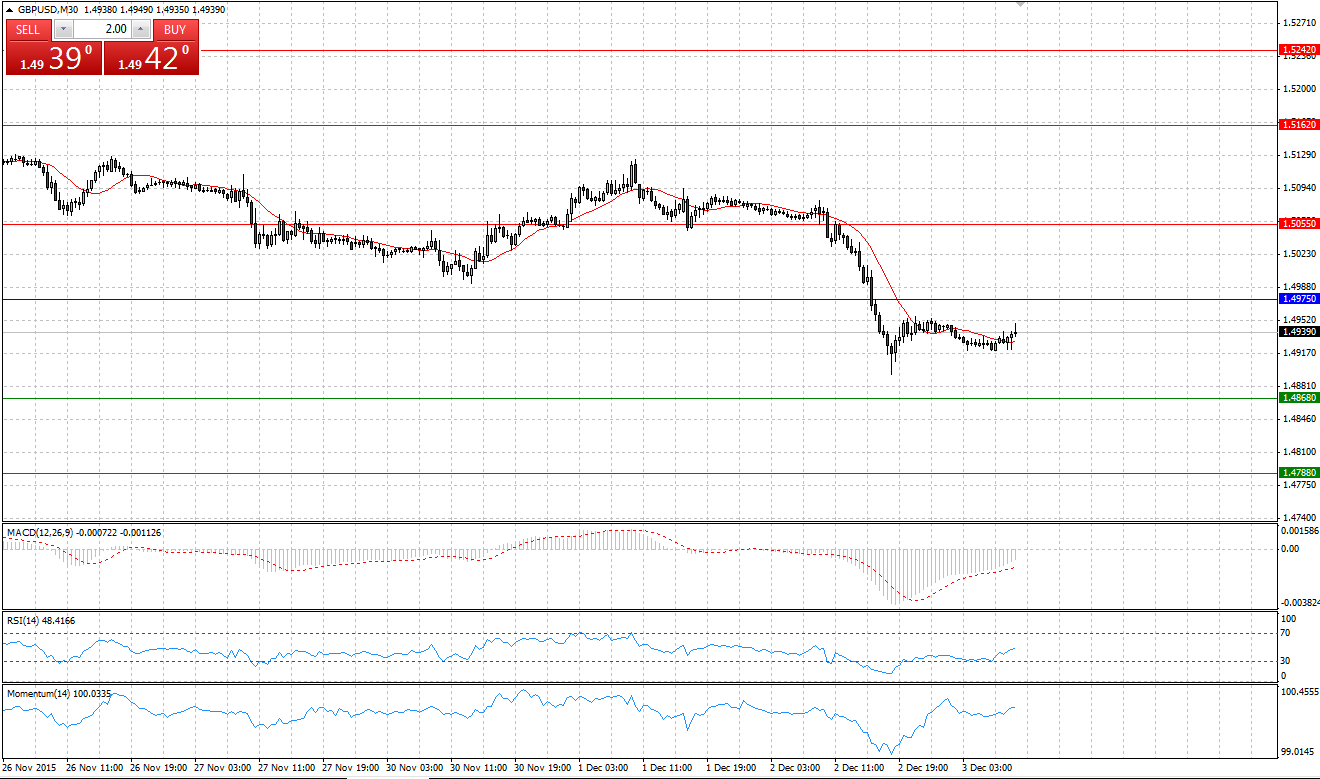
Market Scenario 1: Long positions above 1.4975 with targets at 1.5120 and 1.5162
Market Scenario 2: Short positions below 1.4975 with targets at 1.4868 and 1.4788
Comment: Sterling during yesterday’s session lost 130 pips against US dollar amid slowing UK’s construction growth and positive news from US ADP Non-Farm Employment change, which recorded 217,000 newly employed people in US. Currently the pair is trading below psychologically important level of 1.50 US dollar per GBP.
Supports and Resistances:
R3 1.5242
R2 1.5162
R1 1.5055
PP 1.4975
S1 1.4868
S2 1.4788
S3 1.4681
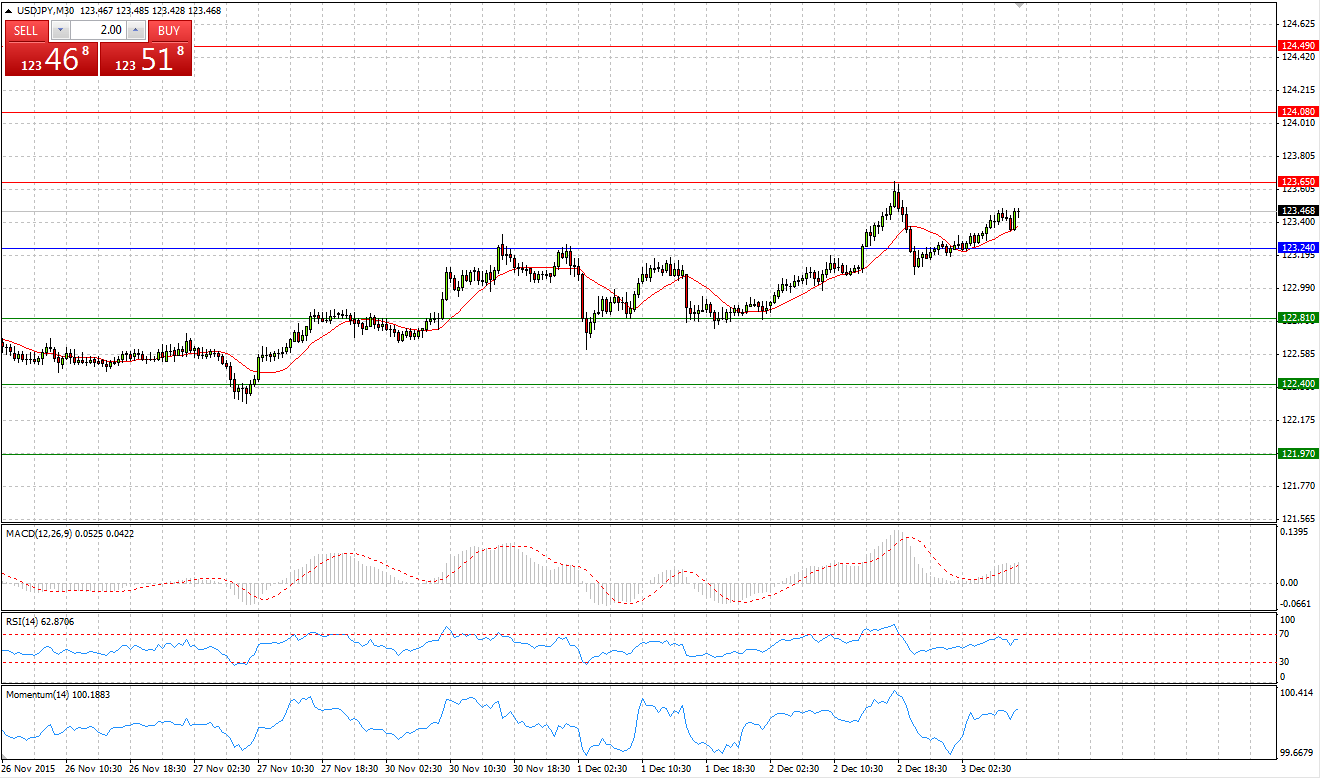
Market Scenario 1: Long positions above 122.92 with targets at 123.21 and 123.56
Market Scenario 2: Short positions below 122.92 with targets at 122.57 and 122.28
Comment: US dollar came very close to its recent highs at 123.65 during yesterday’s session against Japanese yen, however, encountered selling pressure and retreated. Today the pair is trading with a positive bias above Pivot Point level.
Supports and Resistances:
R3 124.49
R2 124.08
R1 123.65
PP 123.24
S1 122.81
S2 122.40
S3 121.97
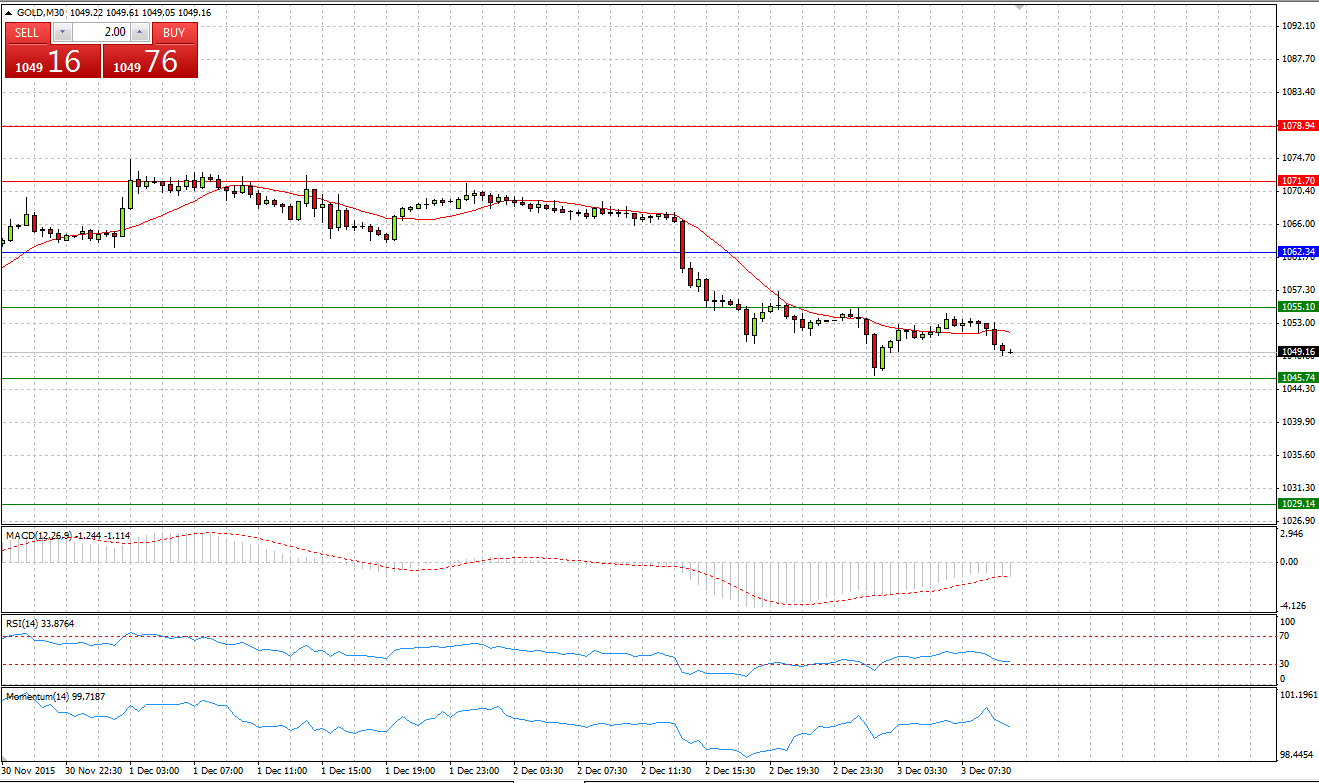
Market Scenario 1: Long positions above 1058.42 with targets at 1066.41 and 1079.38
Market Scenario 2: Short positions below 1058.42 with targets at 1045.45 and 1037.46
Comment: Gold during yesterday’s session came under selling pressure and lost everything it managed to re-gain during previous two sessions, closing the day below its lows at 1053.45. Today Gold continue depreciating against US dollar, sinking below psychologically important level of 1050 US per gold ounce.
Supports and Resistances:
R3 1100.34
R2 1079.38
R1 1066.41
PP 1058.42
S1 1045.45
S2 1037.46
S3 1016.50
CRUDE OIL
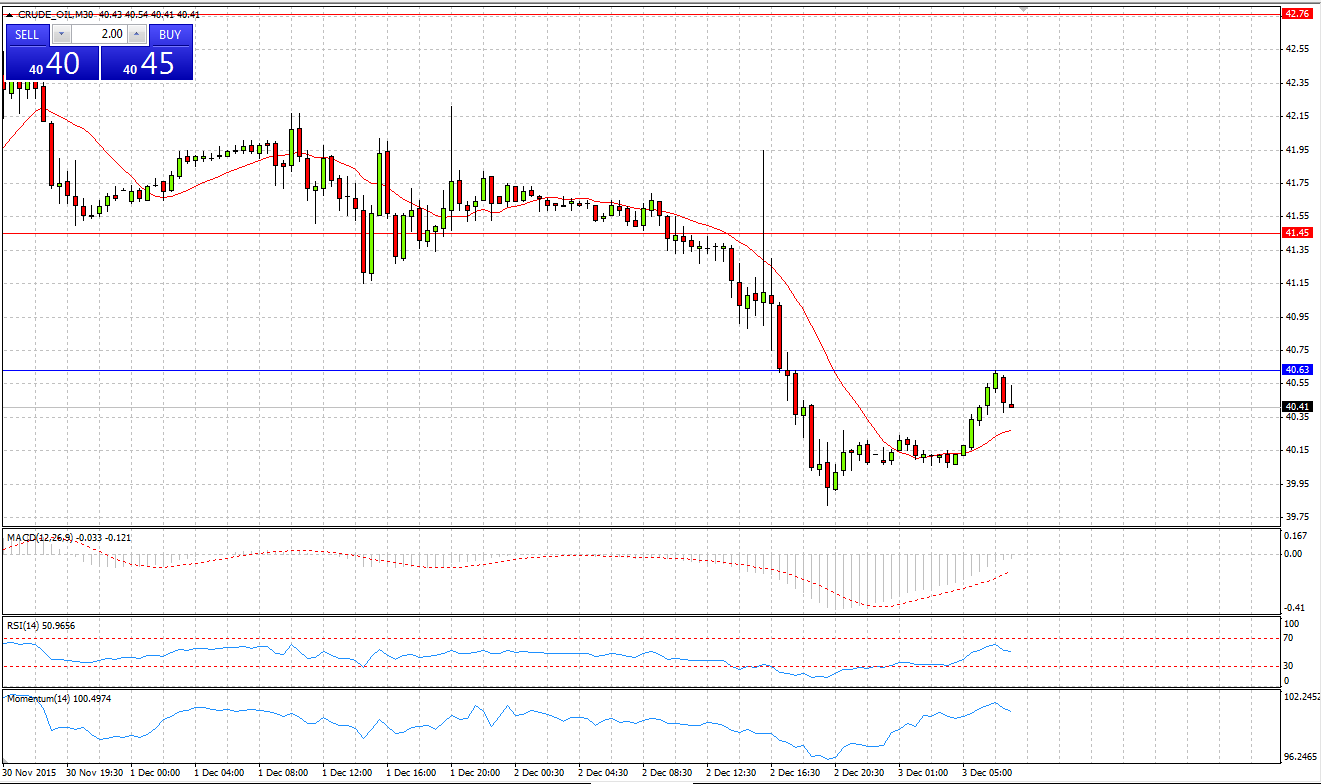
Market Scenario 1: Long positions above 40.63 with targets at 41.45 and 42.76
Market Scenario 2: Short positions below 40.63 with targets at 39.32 and 38.50
Comment: Crude oil continues trading under pressure closing yesterday’s session with 1.5 USD loss. Tomorrow is the OPEC’s meeting, however, according to analysts there little chances that OPEC members will decide to reduce the output in order to stabilize the price.
Supports and Resistances:
R3 44.89
R2 42.76
R1 41.45
PP 40.63
S1 39.32
S2 38.50
S3 36.37
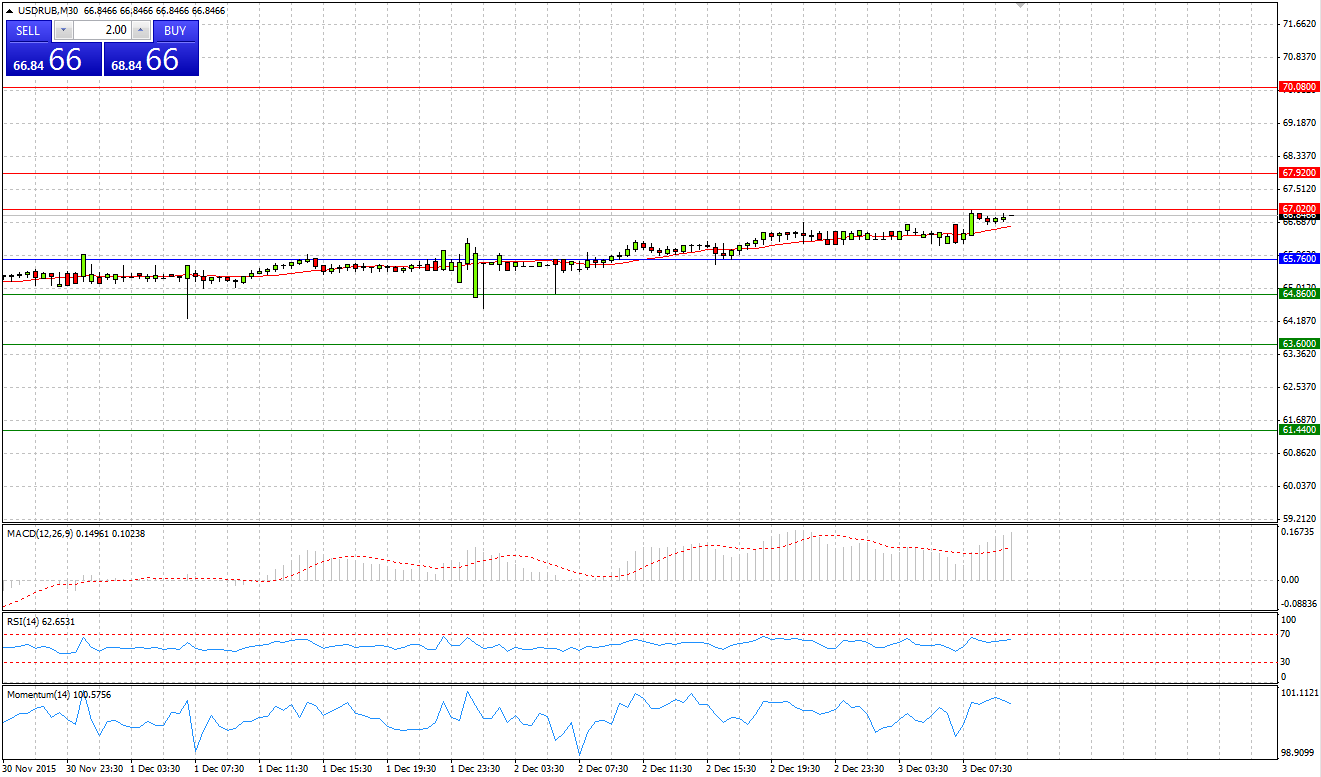
Market Scenario 1: Long positions above 65.76 with targets at 67.02 and 67.92
Market Scenario 2: Short positions below 65.76 with targets at 64.86 and 63.60
Comment: US dollar eventually broke through important level of 66 Ruble per 1 US dollar during yesterday’s session. Today the pair is trading close to 67 ruble per 1 USD.
Supports and Resistances:
R3 70.08
R2 67.92
R1 67.02
PP 65.76
S1 64.86
S2 63.60
S3 61.44
