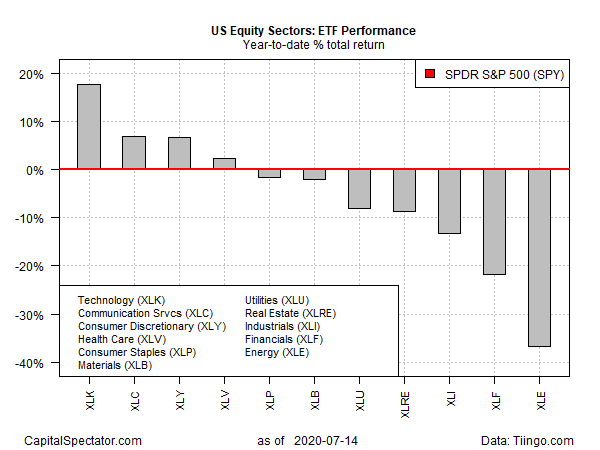
Shares of technology companies continue to hold a wide lead in the US sector race this year, followed by a battle for second place in communication vs. consumer discretionary stocks, based on a set of exchange traded funds as of July 14.
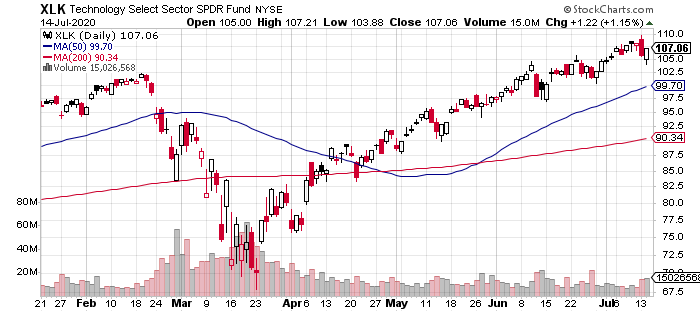
Technology Sector SPDR (NYSE:XLK) remains 2020’s clear leader with a strong 17.7% year-to-date gain. Powered by top holdings such as Microsoft (NASDAQ:MSFT) and Apple (NASDAQ:AAPL), which have posted persistent uptrends this year, XLK is far and away the strongest sector performer.
The rear-view mirror looks impressive for tech, but some analysts worry that the rebounding spread of coronavirus in California, which has triggered a new economic lockdown, is a risk factor for the sector.
“California is specifically a tech haven, so this is going to have a disproportionate effect on tech stocks,” says Connor Campbell, an analyst at Spreadex.
“That is the home of American tech, if that spreads further, if lockdown restrictions get tighter in California, then this will eventually get a knock-on effect on those big tech firms.”

Meantime, there’s a tight race for second place unfolding with Communication Services (NYSEXLC) and Consumer Discretionary SPDR (XLY). The two funds were neck and neck through yesterday’s close via 7.0% and 6.8% year-to-date gains, respectively.
XLC’s definition of “communication services” includes the likes of Facebook (NASDAQ:FB), Alphabet (NASDAQ:GOOGL and GOOG), and Netflix (NASDAQ:NFLX) – top holdings that have performed well so far in 2020.
The only other year-to-date sector gain at the moment: Health Care SPDR (NYSE:XLV), which is up a modest 2.4%. The rest of the sector space (seven of 11 sectors) are still nursing losses in 2020. The deepest setback: energy shares via Energy SPDR (NYSE:XLE), which is down a steep 36.8%.
The US equity market overall is now posting a slight year-to-date gain (0.1%), based on S&P 500 SPDR (NYSE:SPY). The fund’s fractional but positive return for 2020 looks set to strengthen following encouraging news on Moderna’s coronavirus vaccine testing.

The Moderna (NASDAQ:MRNA) news “should further increase confidence that we are getting a robust immune response, in that there should be greater confidence that this will be protective to a degree in transmission of Covid,” says Michael Yee, a managing director at Jefferies.
“This is all along our positive thesis and our view that both Moderna and Pfizer-BioNTech are definitely on a good track to get a vaccine by the end of the year.”
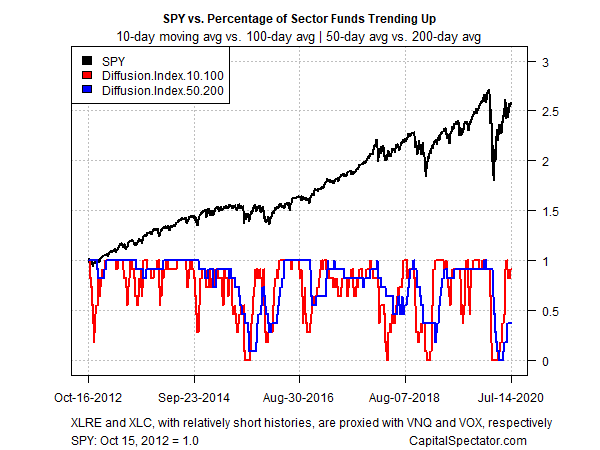
Profiling all the sector ETFs listed above through a momentum lens continues to reflect a strong rebound in the short-term data. The profile in the chart below is based on two sets of moving averages. The first measure compares the 10-day average with its 100-day counterpart — a proxy for short-term trending behavior (red line in chart below). A second set of moving averages (50 and 200 days) represent an intermediate measure of the trend (blue line). Data through yesterday’s close indicates that the bullish short-term momentum has rebounded sharply. Longer-term momentum (blue line), however, has yet to confirm the recent rally.

