As horse races go, this one isn’t close. Shares of technology stocks are far ahead of the rest of the equity sector field this year, based on a set of exchange traded funds. Barring a dramatic reversal in the final weeks of December, it appears that tech will close out 2019 with an outsized gain.

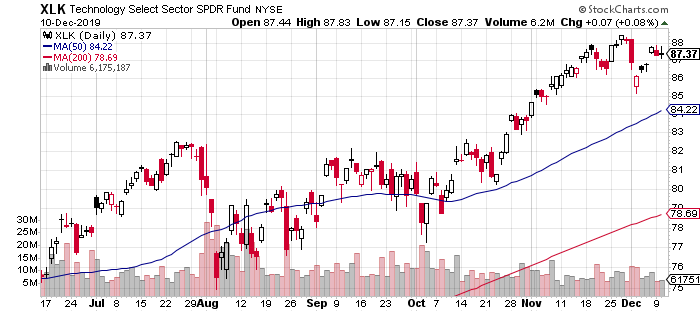
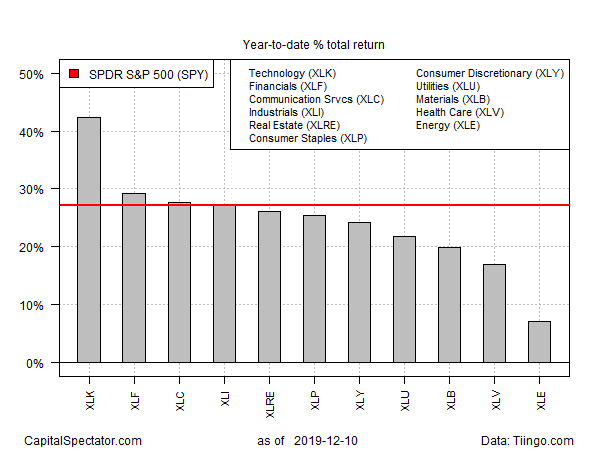
Technology Select Sector SPDR® Fund (NYSE:XLK) closed on Tuesday (Dec. 10) with a red-hot 42.4% total return year to date. The performance leaves the remaining sector funds well behind XLK's blow-out performance in 2019. Based on recent trading, it appears that the fund still enjoys a solid upside bias.
The second-best performer this year: Financial Select Sector SPDR® Fund (NYSE:XLF), up 29.2% so far in 2019. That’s a strong gain, although it’s no match for XLK’s run.
Meanwhile, the spread between the strongest and weakest sector performances this year is conspicuously wide. More than 35 percentage points separates XLK’s 2019 run over Energy Select Sector SPDR® Fund (NYSE:XLE), which is up this year by a relatively muted 7.0%.

Note, too, that the broad market is having a stellar year, in absolute and relative terms. SPDR S&P 500 (SPY (NYSE:SPY)) ended yesterday’s trading session with a 27.2% total return – ahead of seven out of the 11 eleven sector funds in the chart above.
Despite the strong rally in tech, there’s growing concern that proposed regulations could hinder companies in this corner in the years ahead. Democratic presidential candidate Elizabeth Warren, for example, has outlined a plan to break up the major tech firms.
But for now, there’s no sign that investors are worried, particularly for the mega-cap tech stocks. As a New York Times article, earlier this week observed, “Big Tech Is Under Attack, and Investors Couldn’t Care Less.” One of the reasons for the so-far unshakable optimism that graces the largest tech stocks, says Jeb Breece, principal at New York-based money manager Spears Abacus: “They are more economically resilient. A dollar of tech earnings seems like more of a sure bet than a dollar of Midwestern steel earnings.”
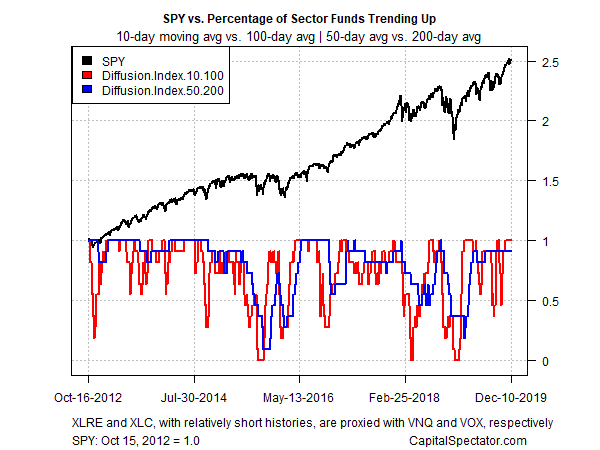
In fact, there’s plenty of optimism to spread around these days. Profiling all the sector funds listed above through a momentum lens continues to reflect a bullish bias generally. The analysis is based on two sets of moving averages for the sector ETFs listed above. The first compares the 10-day moving average with its 100-day counterpart — a proxy for short-term trending behavior (red line in chart below). A second set of moving averages (50 and 200 days) represents an intermediate measure of the trend (blue line). Through yesterday’s close, the two indicators continue to reflect a heavy dose of positive momentum overall.

