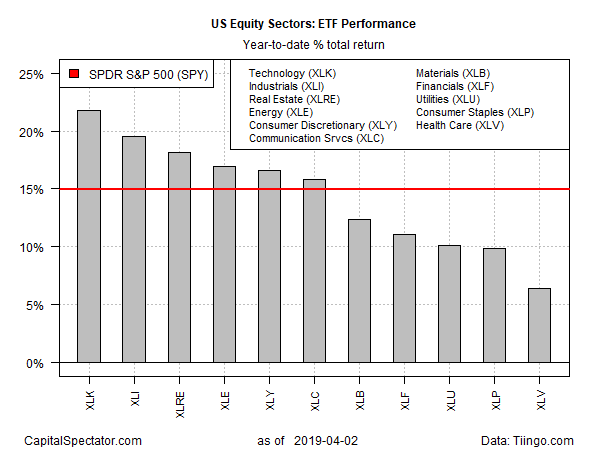
After a brief hiatus in second place earlier this year, technology shares are again the top-performing U.S. equity sector in 2019, based on a set of exchange trade funds. Tech’s re-acceleration, which began in early March, demoted the former leader – industrial stocks – to second place, based on trading through Mar. 2.
Technology Select Sector SPDR (XLK) is up a sizzling 21.8% so far this year through Tuesday’s close. The revival in the sector’s animal spirits marks a striking contrast with 2018’s end-of-year gloom that weighed on the stocks.
“There’s been a lot of unwinding of bad news since December,” notes Eric Green, senior portfolio manager at Penn Capital Management. “The concerns have been absorbed into the stocks, and they continue to trade at reasonable valuations and have strong growth.” He tells Bloomberg that “there’s been progress with trade and a shift in Fed policy that’s encouraging. The rebound makes sense and no one is talking about it.”
The rebound in tech has pushed industrials into second place this year, albeit by a marginal degree. Industrial Select Sector SPDR (XLI) is up 19.5% year to date.
Notably, all the major equity sectors are posting gains so far in 2019. The weakest advance is currently in health care: Health Care Select Sector SPDR (XLV) is ahead 6.4% so far this year.
The U.S. stock market overall is up a strong 14.9% year to date, based on SPDR S&P 500 ETF (SPY).

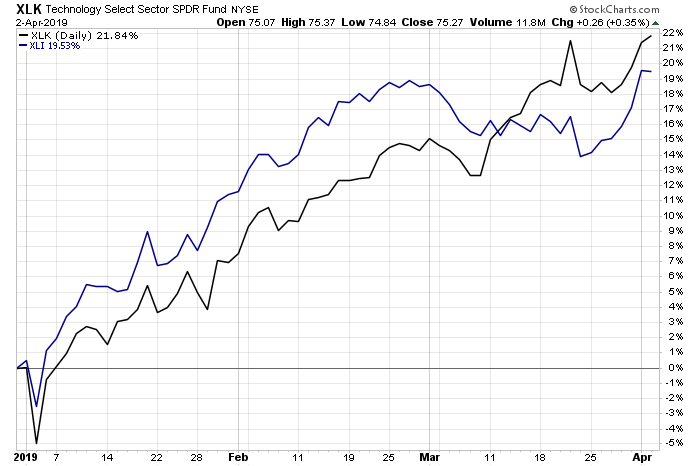
The chart below shows that the former year-to-date lead in industrials (blue line) gave way to tech in mid-March when XLK took the lead (black line). A key factor in the rotation was the stumble in Industrial Select Sector SPDR (XLI), although the ETF has regained momentum over the past several sessions.

XLI may have lost its first-place status, but the ETF’s revival may be laying the groundwork to challenge tech in the weeks ahead. One possible catalyst that may power industrials higher: this week’s news that U.S. manufacturing activity rebounded in March after falling to a two-year low, based on the ISM Manufacturing Index.
But a competing benchmark offered a cautious view. The U.S. Manufacturing PMI last month eased to the lowest level since mid-2017. “A further deterioration in the manufacturing PMI suggests the factory sector is acting as an increasing drag on the U.S. economy,” says Chris Williamson, a chief business economist at IHS Markit, which publishes the data.
Adding to worries for the manufacturing sector: yesterday’s hard data on durable goods orders, which unexpectedly fell in February. A proxy for business investment — orders for non-defense capital goods excluding aircraft – also declined.
Until or if the manufacturing data perks up in a convincing degree, XLI may face headwinds for retaking the lead over tech in the sector space.
