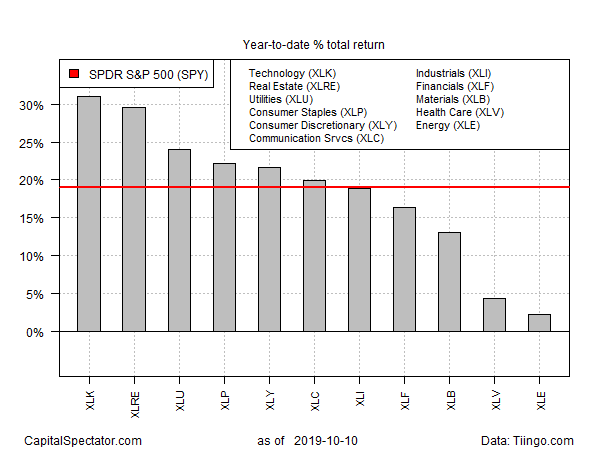
The U.S. stock market has climbed a wall of worry this year, led by technology and real estate shares. The two sectors have been red hot for most of 2019 and that’s still true by wide margins, based on a set of exchange traded funds.
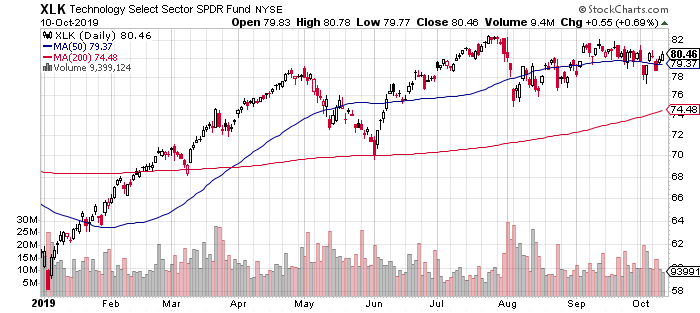
Technology Select Sector SPDR (NYSE:XLK), the strongest year-to-date performer, is currently posting a sizzling 31.1% total return through yesterday’s close (Oct. 10). Although the fund has been treading water for the last two months, it continues to change hands just below a record high that was set in July.
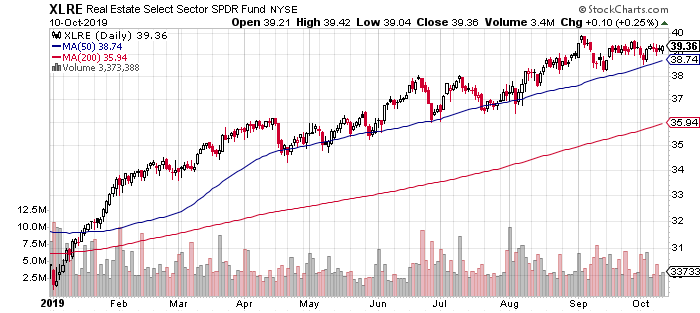
Shares of real estate investment trusts (REITs) are a strong runner-up performer this year. Real Estate Select Sector SPDR (NYSE:XLRE) is ahead by 29.6% this year after factoring in distributions. In contrast with XLK’s recent meandering run of late, XLRE’s enjoyed a relatively consistent, ongoing climb through 2019.
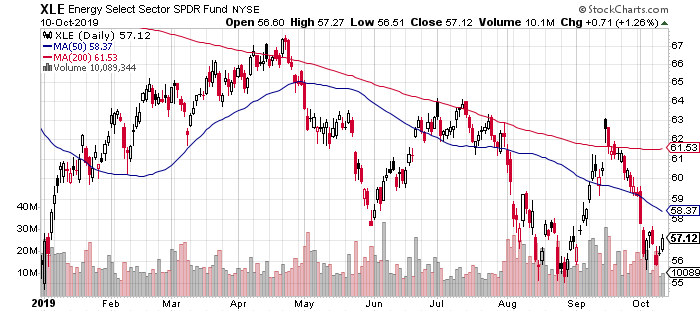
All the major U.S. equity sectors are posting year to date gains, but there’s a wide spread between the leader and the laggard. Energy shares are the weakest corner among the major U.S. sectors. Energy Select Sector SPDR (NYSE:XLE) is up just 2.2% in 2019 and is struggling to hold to a slim gain.
One analyst sees energy’s weak run this year as a possible value opportunity. “We believe favorable technicals, improving fundamentals with stabilizing business cycle, and ongoing geopolitical tensions in the Middle East could help redirect flows into this universally hated and cheap sector,” Dubravko Lakos-Bujas, chief U.S. equity strategist for JP Morgan Chase, wrote in a research note recently.
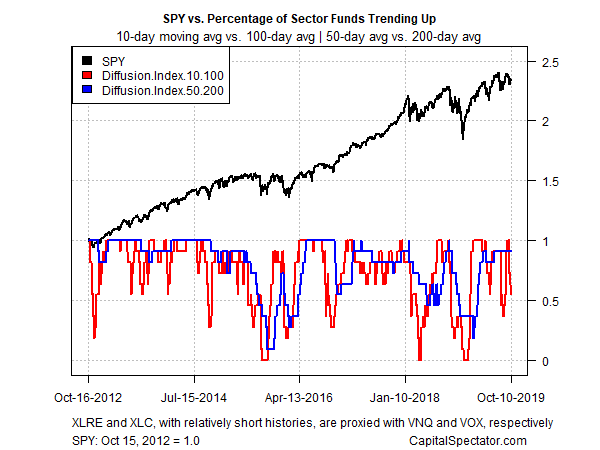
Reviewing momentum for U.S. equity sectors continues to reflect an upside bias generally, but recent trading reflects a round of weakness for the short-term profile. The analysis is based on two sets of moving averages for the ETFs listed above. The first compares the 10-day moving average with its 100-day counterpart — a proxy for short-term trending behavior (red line in chart below). A second set of moving averages (50 and 200 days) represents an intermediate measure of the trend (blue line). As of yesterday’s close, the two indicators continue to reflect positive momentum for most sectors. Note, however, that the short-term metric has tumbled recently. So far it looks like noise, but the question remains: Will the intermediate trend (blue line), which remains much stronger, weaken too? If this measure of momentum stumbles, the outlook will suffer.
