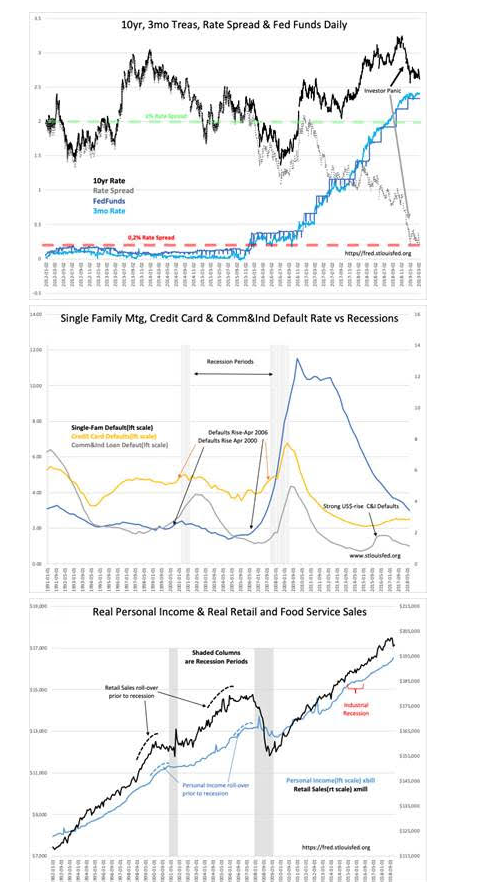
History from 1953 indicates that when the T-Bill/10 year Treasury Rate Spread falls to 0.20% or lower a recession occurs, but not this time. The daily T-Bill/10 year Treasury Rate Spread data from Jan 2012 provides insight when coupled to other economic data and media reporting.
Algorithmic trading has become a significant feature of Momentum Investor activity that was not as significant 20 years ago. It has evolved with traders seeking advantages over other investors with momentary opportunities which require computer-driven high-speed trading. Every trader seeks a time advantage over others and every trick and head-fake are used to advantage. Once a trend develops which is too significant to ignore, all the algorithms become coordinated. This occurs because the high levels of leverage applied to algorithmic trading forces adherence to any significant trend. Falling into coordination are mathematical algorithms which without human intervention or counter interpretation read significant price trends identically. Trend followers are not Value Investors and represent only part of the investor psychology inputs to prices.
Value Investors separate trends from fundamentals. Their focus on broad economic fundamentals and individual corporate financials provide a counter influence to Momentum Investor price trend algorithms. Throughout market history, it is Value Investors who buy securities using fundamentals which Momentum Investors ignore. Value Investors are always active buyers during the period of market panic. John Templeton, a famous Value Investor, often said,
“Bull markets are born on pessimism, grown on skepticism, mature on optimism, and die on euphoria.”
“The time of maximum pessimism is the best time to buy, and the time of maximum optimism is the best time to sell.”
Knowing that this time is different for the T-Bill/10 year Treasury Rate Spread in part comes from insider buying. Corporate insider accumulation (considered the most knowledgeable Value Investors) rises historically during severe market panics as equity prices are in steep discounts to future financial expectations. John Templeton recognized this. Market and economic peaks have never occurred during periods of pessimism. The requirement of a recession and severe market correction is that investors and businesses must be over-extended through a prolonged period of investor euphoria. The term ‘over-extended’ refers to using too much leverage in business and personal borrowing such that a slowing in additional lending leads to being unable to paper-over bad debt with new lending. Defaults have always risen rapidly when an over-levered economy meets reduced lending. This condition leads to even more lending restrictions. A situation that is not present today.
Economic conditions represented in Single Family Mtg, Credit Card & Comm&Ind Default Rate vs Recessions indicate default rates are trending lower. An important feature of our current economic condition is the recent rise in Real Personal Income which should continue to drive default rates even lower. The trend in Real Personal Income reflects an acceleration due to recent government policy initiatives including tax and business regulation reductions. Historically Real Personal Income and Real Retail Sales roll-over noticeably prior to market and economic corrections leading to recessions. None of these warning signals are present today.

The signal provided by the T-Bill/10 Year Treasury Spread Rate requires a different interpretation this time. The signal has always in the past been accompanied by a period of investor euphoria driving both T-Bill and 10 Year Treasury rates higher. It is the rise of investor euphoria as observed by John Templeton which drives rates higher as investors swap out Fixed Income positions for expected higher returns in Equities. This behavior is a classic characteristic of market tops. The process is capped when T-Bill rates rise faster than the 10 Year Treasury rate (acting as a proxy for lending margins) indicates lending margins becoming unprofitable. Speculative equity behavior drives rates higher which is why lending slows just as investors have become most speculative.
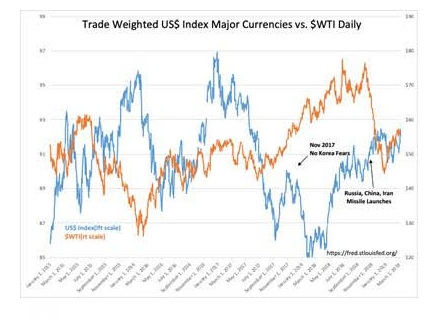
The signal created today comes from the 10 Year Treasury rate falling while the T-Bill has been rising. This activity is correlated to the US$ (US Dollar strength) the past 10 Years as global wealth has sought safe haven in US$-priced assets. This is especially so for the 10 Year Treasury and US real estate both of which have been at historically high price levels for some time. What we see today is a culture clash between very experienced US investors with a business returns’ perspective vs. foreign investors seeking safety with return of capital being the primary concern. The 2%-3% returns in 10 Year Treasuries or real estate are sufficient because this lets them avoid native government confiscation and collapsing currencies. US investors view 2%-3% as uncompetitive. Foreign capital saw additional panic in 2014 when Russia invaded the Ukraine, the US$ rose sharply and has remained elevated.
Sept 2018-Jan 2019 saw additional panic with Chinese, Russian and Iranian missile launches. Russia and Iran accompanied these test launches with verbal threats against the US. In addition the Chinese tightened stock margin rates as US tariffs weakened trade which sent the FXI(China Large Cap iShares ETF) lower beginning a sell-off in the US. Global recession fears rose on the resulting price decline which induced further panic resulting in more US$ strength and falling oil prices. The media said we faced another “Great Depression”. Momentum Investor algorithms correlated accordingly. What has not correlated is economic activity which remains in expansion.
The Net/Net is financial conditions remain strong even if the pace of lending slows. Buy stocks. Substantial upside remains in spite of fears to the contrary. A positive outcome to Chinese tariff discussions is likely to add to the rise in market prices.

Disclaimer: The information in this blog post represents my own opinions and does not contain a recommendation for any particular security or investment. I or my affiliates may hold positions or other interests in securities mentioned in the Blog, please see my Disclaimer page for my full disclaimer.