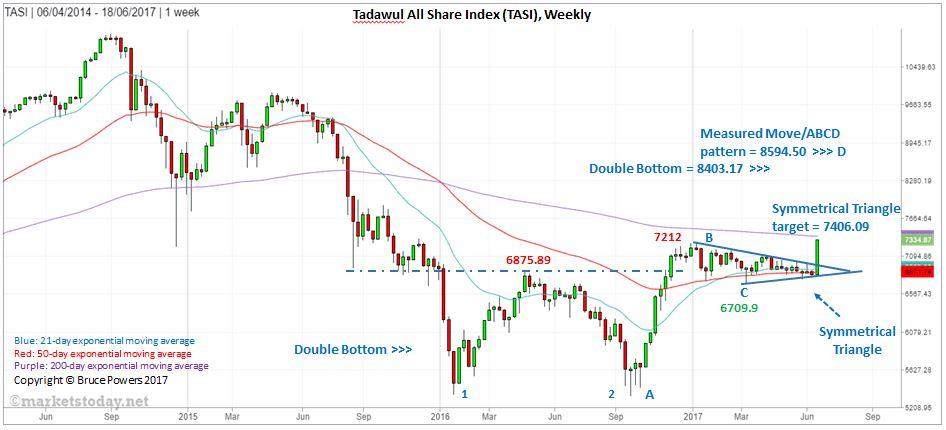
Saudi Arabia's Tadawul All Share index broke out of a multi-month Symmetrical Triangle consolidation pattern on Monday, providing the first trigger for a continuation of the long-term uptrend. Volume reached a 7-day high but remained subdued near the range of one-year lows.
Yesterday, strength of the breakout was confirmed with a sharp 5.5% advance and the highest volume since mid-December, which was before the Triangle began to form. Also, the index closed at 7,334.87, above the top of the Triangle, which is at 7,290.33. This is the highest daily close since mid-October 2015.
So far we’re seeing very bullish behavior which points to higher prices in the Tadawul over the coming weeks and months! There are three core chart patterns investors and traders should be aware of when considering objectives or targets for the TASI.
Symmetrical Triangle
The first target of approximately 7,406.09 has almost been reached and it is derived by measuring the price height of the Symmetrical Triangle and adding it to the breakout level (7,009.93).
Double Bottom
The TASI broke out of a large Double Bottom pattern in late-November and then consolidated gains to form the Symmetrical Triangle. A long-term target measured from this pattern is around 8,403.17.
Measured Move/ABCD Pattern
The swings identifying a Measured Move or ABCD pattern is noted on the chart by the letters ABCD. This pattern assumes that the second leg up in the uptrend off the October 2016 low matches the price appreciation of the first leg up. It reflects potential symmetry between price swings. The target from this pattern is 8,594.50.

