Saudi Arabia Stock Market Technical Update: Tadawul All Share Index (TASI)
- Larger advance stalls at the 50% retracement zone.
- Deeper short-term pullback may occur.
- Followed by advance to new highs.
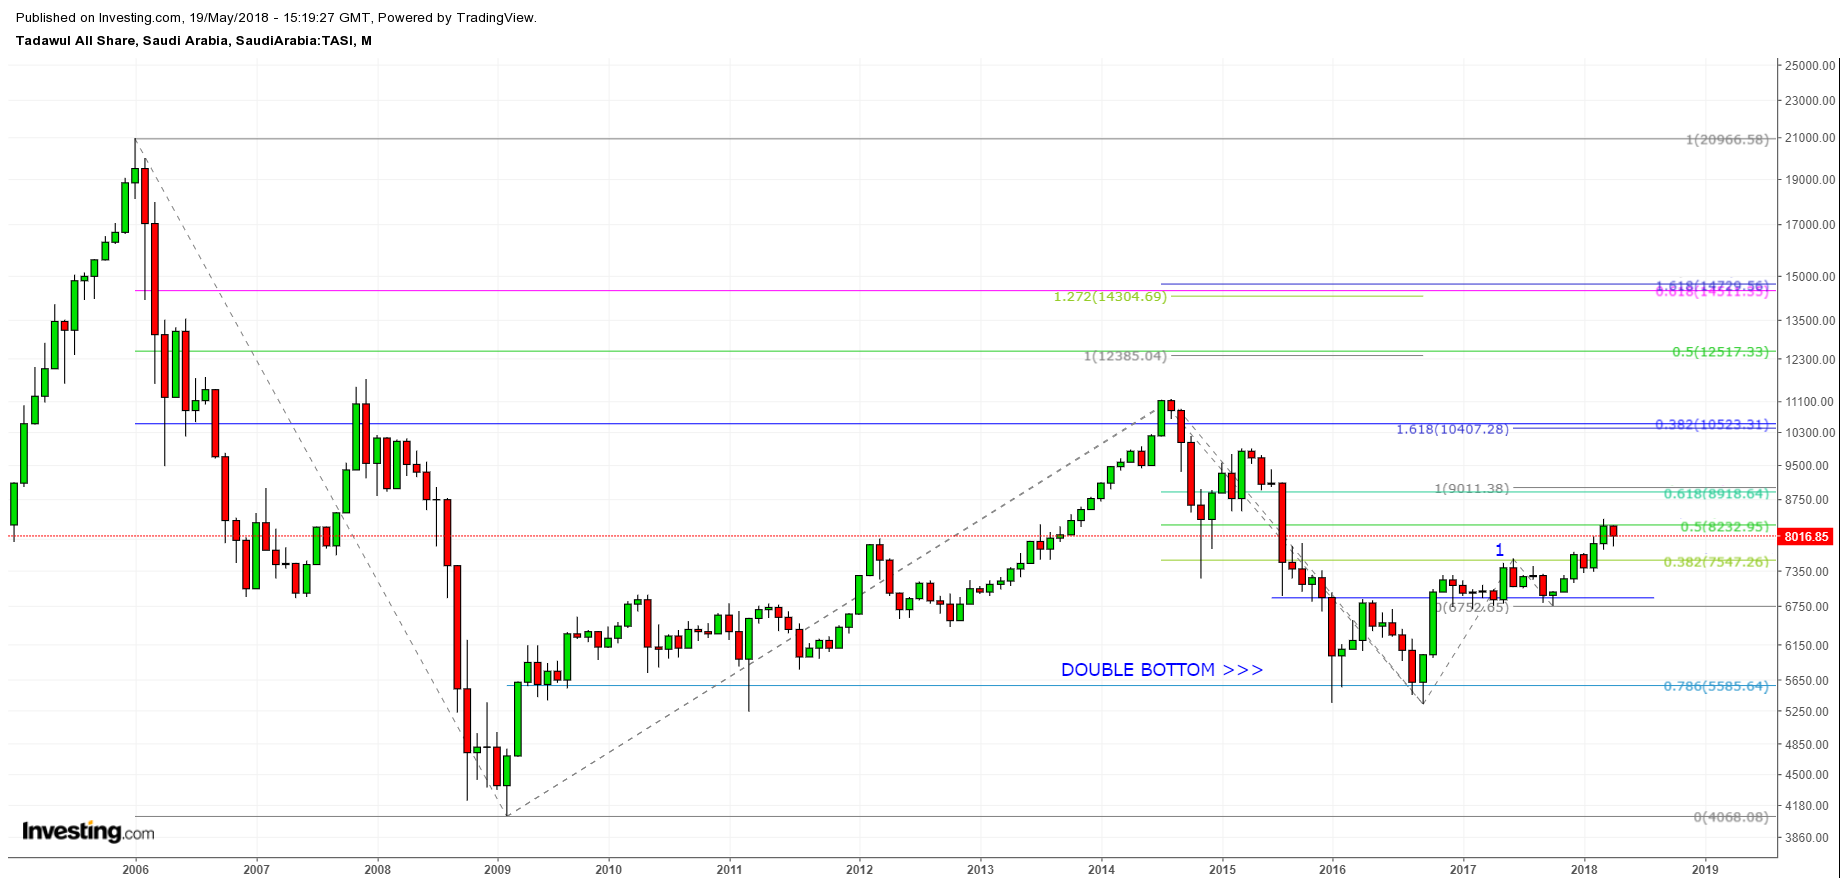
In the monthly chart below we see the big picture for the Tadawul All Share Index (TASI) (Saudi Stock Exchange) with future potential targets denoted by Fibonacci confluence, where at least two Fibonacci measurements identify a similar potential resistance zone. In addition, we are seeing further short-term resistance around the most recent high of 8,345.19. That’s a 33-month high.

Note that resistance was seen at the 38.2% retracement level at point 1 on the monthly chart, which led to a four-month pullback. Subsequently, the advance continued reaching the 50% retracement of 8,232.95 last month. The index has since stalled its advance around that resistance zone. It’s certainly possible that a deeper retracement may ensue before the larger uptrend kicks in again. It is expected that the uptrend will continue higher given the higher price targets and the structure of the advance so far off the double bottom trend reversal pattern that formed from January 2016 to October 2016.
Potential intermediate to long-term target zones:
- 8,919 – 9,011
- 10,407 – 10,523
- 12,385 – 12,517
- 14,305 – 14,729
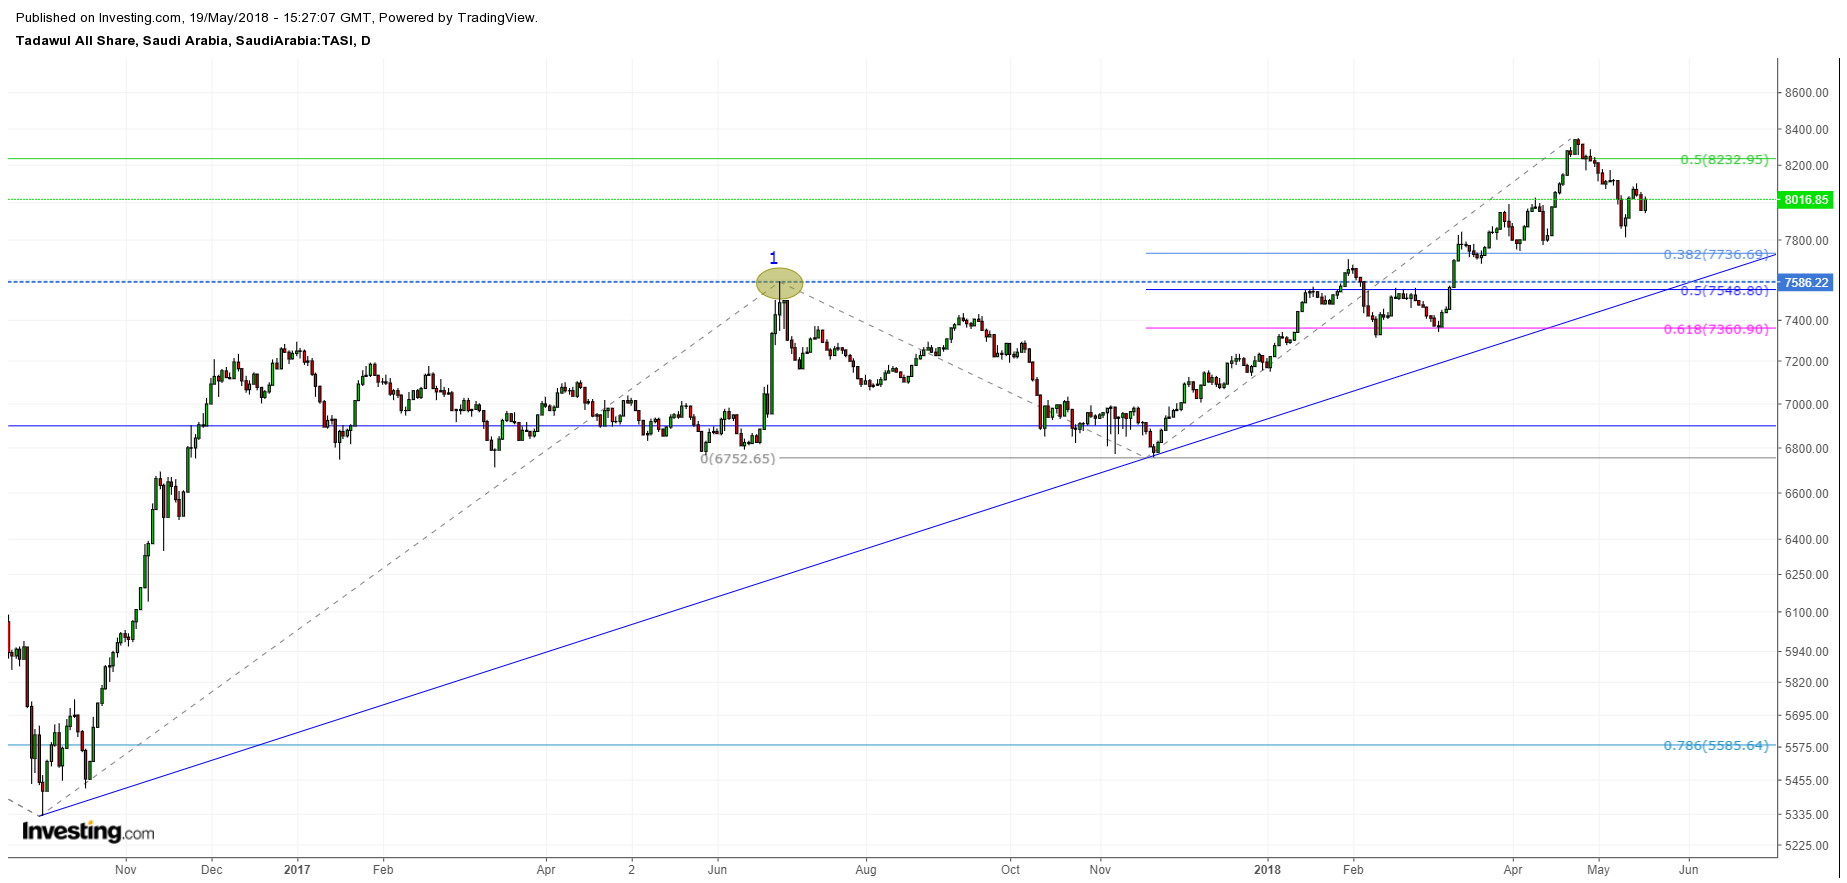
This next chart below is a daily chart of the TASI. Here we take a closer look at the near-term uptrend. Fibonacci retracement levels are drawn from the most immediate uptrend coming off the November 2017 low. Along with the uptrend line they can provide some guidance as to where to look for support levels that might hold to the point to turn the TASI back up.

