Near-Term Outlook for the Tadawul All Share Index (TASI) Turns Bearish –Bearish Wedge Triggered
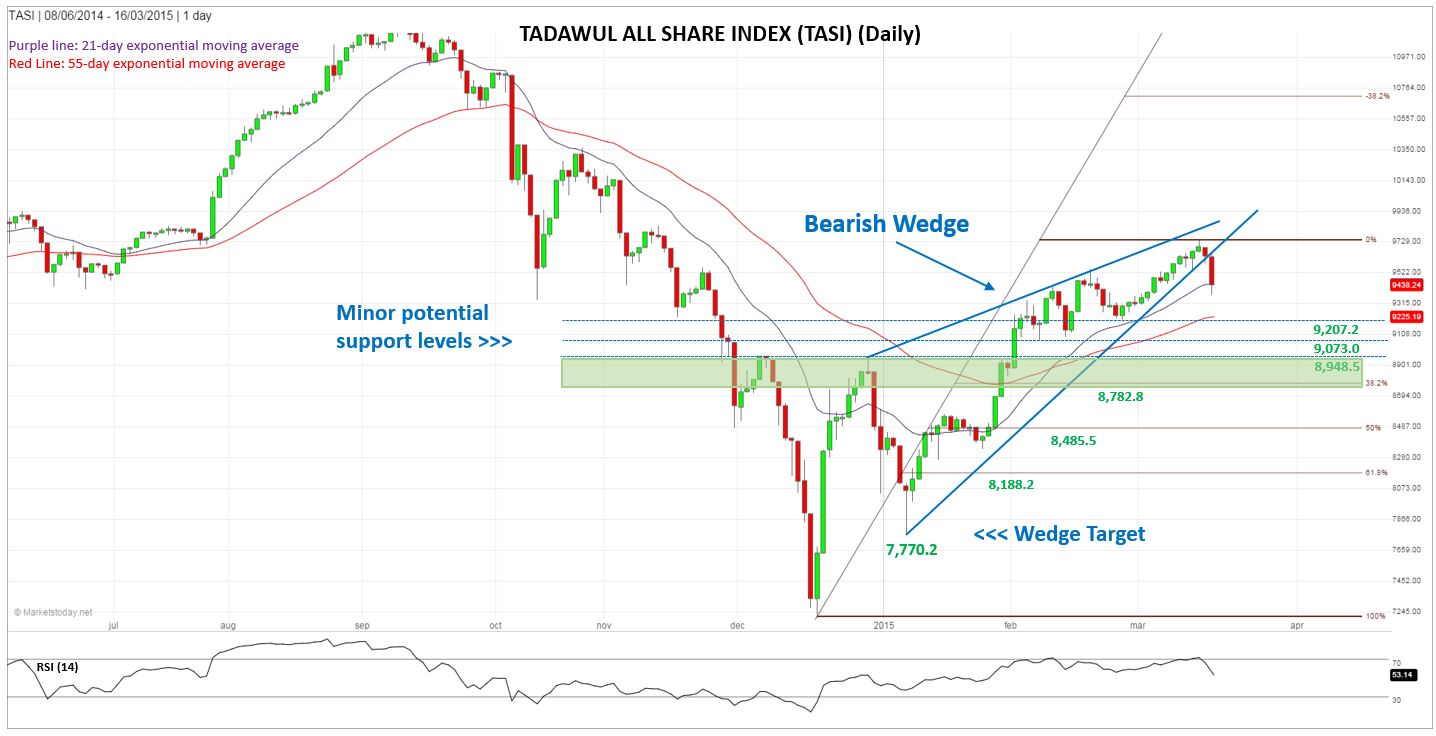
The TASI (Saudi Exchange) has joined other GCC markets in turning near-term bearish. Yesterday, Monday, the TASI fell by 190.41 or 1.98% to close at 9,438.24, a nine-day low and below the prior week’s low. It ended right at short-term support of the 21-day exponential moving average (ema), following a decline through it to the low of the day at 9,377.

Of significance is that the decline triggered a breakout of a large bearish wedge pattern that has been forming since the beginning of the year. It was a decisive decline and occurred on higher volume, the highest in 21 days! The top of the wedge was at resistance of the 200-day simple moving average.
The target for a wedge pattern is the beginning of the formation. In this case the eventual target would be 7,770.17. A daily close above the recent peak of 9,745.22 would be needed to invalidate the current wedge formation. In the interim there are other price levels to watch for a bounce. Minor levels are marked as such on the enclosed chart.
The first potential support zone of greater significance is from approximately 8,948.5 to 8,782.8, consisting of prior resistance (now support) and the 38.2% Fibonacci retracement level, respectively. Once a retracement has begun, as it likely did yesterday, a market has a strong probability to retrace at least 38.2% of the prior advance. This means that the TASI can be expected to, at a minimum, reach the lower part of this first key support zone.
Technical Summary:
- Breakout of Bearish Wedge on higher volume (21-day high)
- Ends at a nine-day low
- Closes below prior week’s low
- RSI turns down from overbought
- Top of wedge (top of uptrend) finds resistance near 200-day simple moving average
- Minimum Fibonacci retracement expectation of 38.2% is a ways lower
- Target for wedge is much lower
