Last week's missive called for some natural pullback in the price of Gold near-term prior to its then continuing higher over the broader time frame. Any near-term pullback notwithstanding, let's assess a very supportive reality for then broadly higher Gold prices.
The beauty of mathmatical science is that the numbers don't lie, admittedly the interpretation of results being dependent upon the quality of the data used, which we "trust" to be accurate, (the growing skepticism of government reporting methods notwithstanding). In any event, if what you see below continues to unfold and becomes more visible to the nation at large as it works its way deeper into daily economic activity, it would not surprise me a wit for the FOMC at the very least to put "on hold" its policy for tapering the Fed's monetary accomodation, perhaps as soon as 18 June. Maybe even three meetings from now, this that allows enough time for the "uh-ohs" to set in, albeit I suppose this first graphic could be printed out striaght away and stuffed into an enveloped addressed in legible crayon to: "Old Yeller, Head Teller -- FRB, Washington, DC".
I doubt if we've ever presented the Economic Barometer in now three consecutive Gold Updates, let alone lead with it. But the decline of the Econ Baro has become so alarming of late -- especially as in seemingly blissful ignorance the S&P stays aloft -- that 'tis important to get the picture out there. The image in this case differs slightly from that presented daily at the website as we've added Gold and put both it and the S&P 500 (red line) on like percentage change tracks from a year ago. So with the Baro in free fall, here's a thousand-word picture:
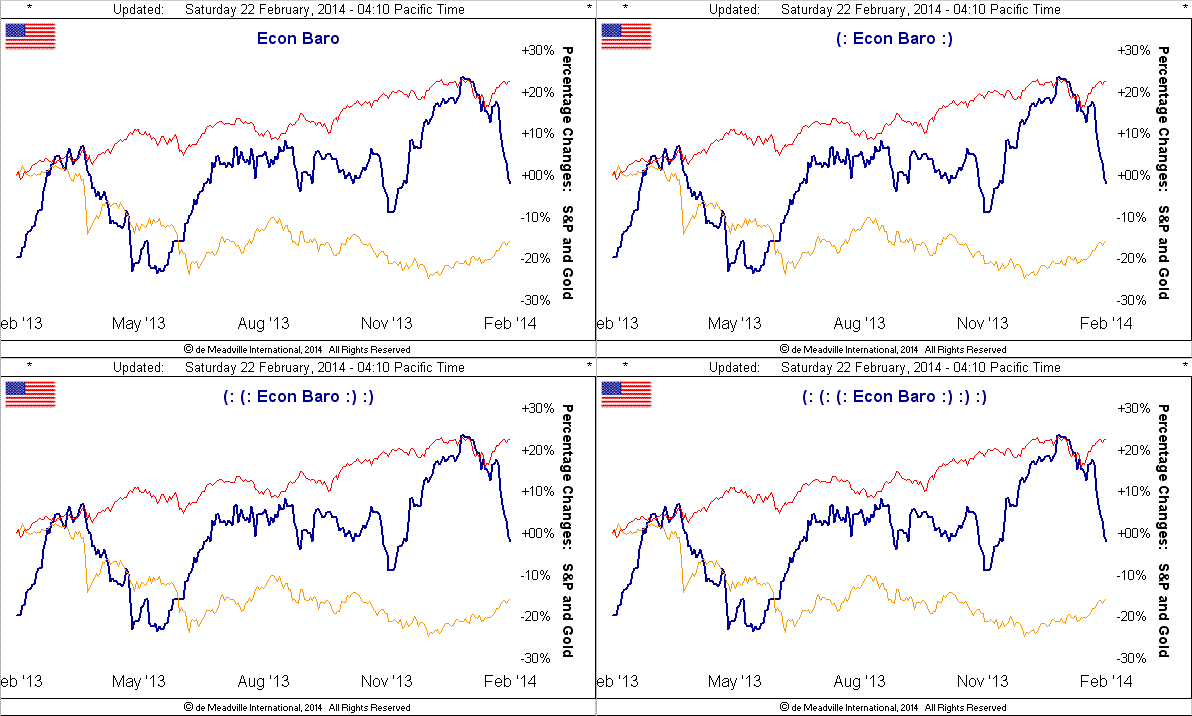
Having produced the Econ Baro since 1998, we know that historically it has a remarkable record of directionally "leading" the S&P. And yet for well over a year now, just as it has ignored lackluster earnings, so too has the S&P blown off recent lapses in the economy. And given Gold's reinforcing resilience in spite of tapering, Gold "knows" the economic elements which formulate the above barometer are becoming indicative of the Fed's taper itself becoming more tapered if not terminated, and moreover the monetary tap then being turned farther open.
More importantly, given the torrid pace of debt creation and currency debasement, you and I "know" the price of Gold here at 1326 -- when mathematically measured as a mitigant to metastasizing money supplies -- is far too low. Back in the 11 January Gold Update we wrote: "...'twould be a terrific achievement if Gold by mid-year could rise across the 1466 threshold...". What then admittedly appeared as a stretch now looks reachable. (And for you math junkies out there, although we've still the expectation for a modicum of near-term pullback, extrapolating Gold's linear-regression trend year-to-date puts the mid-year price at 1559, and for year-end at 1894; however, as markets do not move in a straight line, 'tis perhaps best to keep that under your hat, at least for the present).
'Tis said during early periods of central banks' monetary withdrawal that equities tend to flourish, for the powers-that-be sense economic improvement. 'Tis also said to be the reverse upon the institution of monetary accommodation, which remains something to bear in mind as rates are still relatively low and to which the FOMC continues to state shall be the case for the foreseeable future (despite their contrarily expressing a willingness to start raising short-term interest rates sooner than expected ... really?), and money thus freely flows into equities because "there's no place else to put it". Is it any wonder we remain on "crash-watch"? In these days of a practically correction-less S&P, the blurring cycles of market psychology revolve ever faster, ultimately spinning beyond the red line such that as does a rod in a billionth of a second go awry by just a scant millimeter in a Formula One engine at 16,000 rpm, of a sudden comes its comprehensive meltdown. And sadly, most don't see it coming.
I had the occasion at the height of Thursday morning's rush hour to travel through San Francisco's subway system toward the financial district. In my day, the jam-packed car would be packed with "suits", standing tall and alert, either pouring over their freshly inked morning papers or engaged in polite conversation. Today 'tis 180° out of phase: I saw little if any reading or conversation, the entirety of the car's patrons at best disorderedly dressed, either asleep in their seats, their television-tired eyes tightly shut and earbud-plugged bodies in full slump, otherwise standing with heads bowed staring into mobile devices for signals never to reach dozens of meters below the surface of the earth. The whole darn scene was downright depressing and 'tis those very daily grinders whose income, credit capacity and retirement savings are on the line. Sobering, scary stuff. Educate, else evacuate.
"...or read The Gold Update, mmb!"
I appreciate the shameless plug, Squire, thank you. (Ya gotta love the boy's enthusiasm). We're simply trying to do our part.
And thus to Gold's weekly bars we go. Note the newly-added dashed line that depicts the full year-over-year linear regression trend to emphasize price's peregrinations from it, which is further rationale right now for our anticipation of some natural near-term pullback:
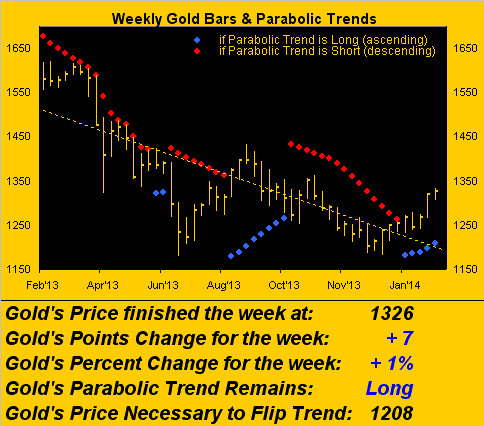
Again, such notion for natural pullback was the subject of last week's missive, ("natural" because of price's tendency not to stray too far afield from what we term as its Market Magnet at which we'll next look). Still, Gold closed out the week with yet another gain, indeed its eighth in the last nine -- and we're not complaining a wit! -- further underscoring that which was written two weeks ago: "...Gold's tide through its ebb and flow is truly turning northward...". But moreover, the resiliency and steady climb of price so far in 2014 is the most consistent upside pace that Gold has achieved in better than a year and is in stark opposition to the consistent (understatement) decline now being portrayed as we just saw for the Economic Barometer.
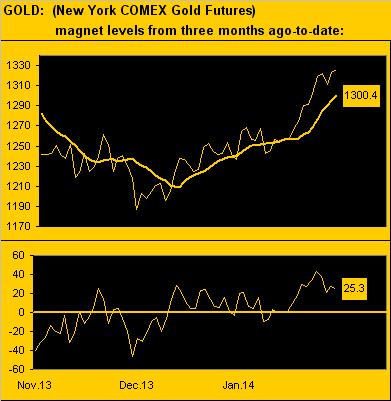
As for Gold vis-à-vis its Market Magnet, in the upper panel of this next graphic that tracks Gold's daily closes over the past three months, we can see that price (1326.0) is a bit higher than 'twas a week ago. Yet Gold's Market Magnet (the thick line at 1300.4) is in a more uninterrupted rise such that the lower panel oscillator "gap" (price - magnet = 25.3) is narrowing. 'Twould not be untoward for price to meet magnet in the ensuing week:
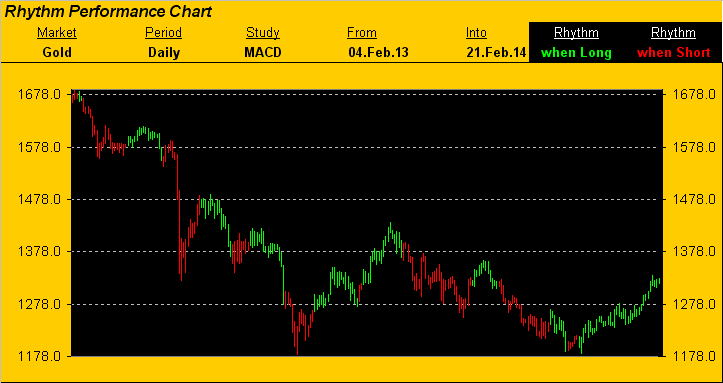
Next let's assess the best Market Rhythm we've got going for Gold right now: the classic MACD (moving average convergence divergence) study on the daily price bars. Here's the picture from just over a year ago-to-date. Again, rather than display the MACD study itself, when the price bars are green, the study is positively disposed (i.e. Long), and vice-versa when red. What we're simply noting now is that the duration of the current green up trend -- (and again we're not complaining!) -- has become quite lengthly compared to that of prior trends regardless of direction, and thus some near-term dip can at least be technically rationalized. Of course, the long-term Gold investor couldn't give a derriére du rat about this, but we're just tryin' to keep you trader-types out there on yer toes:
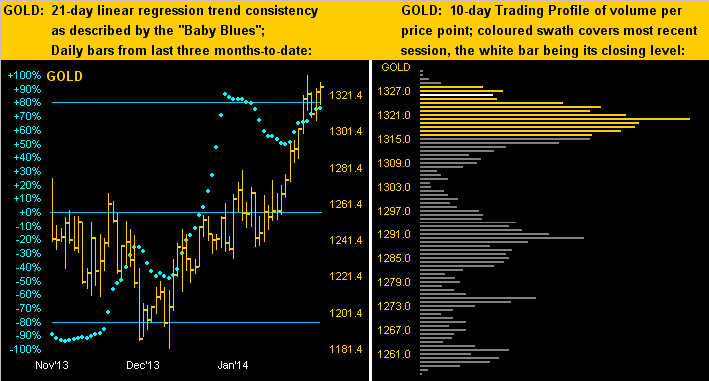
As to how far would be the dip of an imminent Gold trip? By either the above chart or the left hand-panel of this next graphic, the prior highs of resistance in the low 1280s to upper 1270s can act as support; note too how the "Baby Blues" have overcome their own recent weakness and resumed higher, (our full-year data of the Blues show such a reversal as not even occurring at all last year), suggesting the "linreg" trend is sufficiently up so as not to warrant too much downside; and with an eye to the right-hand panel, the four most dominate underlying apices are 1320, 1290, 1275, and 1262. So how about a near-term dip down to 1275 and then Gold can continue toward mid-year on the broader run to 1400+, (pausing en route, of course, for tea at Base Camp 1377)? All those in favour say "AYE!":
Prudently 'tis again worth pointing out that Gold's directional correlation to the S&P has changed from negative to positive as next shown in this expanded, comparative percentage track view, this case extending from Gold's December low-to-date. The yellow metal is +11%, the S&P not quite +2%...
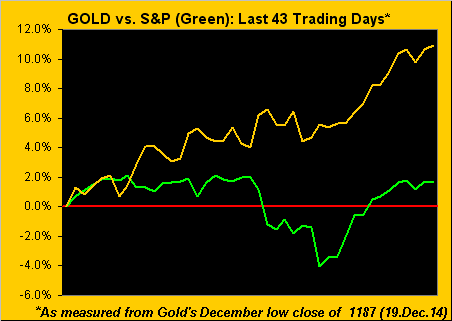
... and "prudently" because given the now-positive correlation of these two markets, would an S&P fall take Gold down with it? I'd rather expect a return to negative correlation wherein Gold gets the bid as doth the S&P skid.
Speaking of which, beyond our measured lack of real earnings growth -- and thus my harping upon a very material decline for the S&P -- another downside catalyst as we've oft stated shall be the demand for dough. With respect to our aforementioned fellow subway schlubs, 'twas reported this past week that consumer borrowing StateSide grew by the biggest amount in six years as more Americans took on debt to buy houses, cars and to pay college tuitions. And oh where to turn when the credit lines max out? What happens when the bankers say "No"?
Furthermore, what if there aren't any bankers? To wit these late-week headlines from the FinTimes: "RBS plans dramatic scaling back ... At least 30,000 staff could be cut in the coming years ... RBS to shake up management team ... RBS share sale delayed after £8bn loss". Have a nice day.