The vast majority of dollars invested in volatility oriented securities are bets that volatility will go up. Sometimes these bets are speculative, but more often they’re portfolio insurance. These long volatility bets have proved to be quite expensive—the holding costs are high.
Taking the other side of the deal—shorting volatility, or buying products that track daily inverse volatility is quite profitable most of the time, but when volatility spikes the losses can be heavy.
Consistent profits in inverse volatility are contingent on achieving these two goals:
- Be out when there are big volatility spikes
- Take advantage of the contango/time premium that drains value out of long volatility positions (75% to 80% of the time on average).
Recently I found a strategy that that looks promising for achieving these goals.
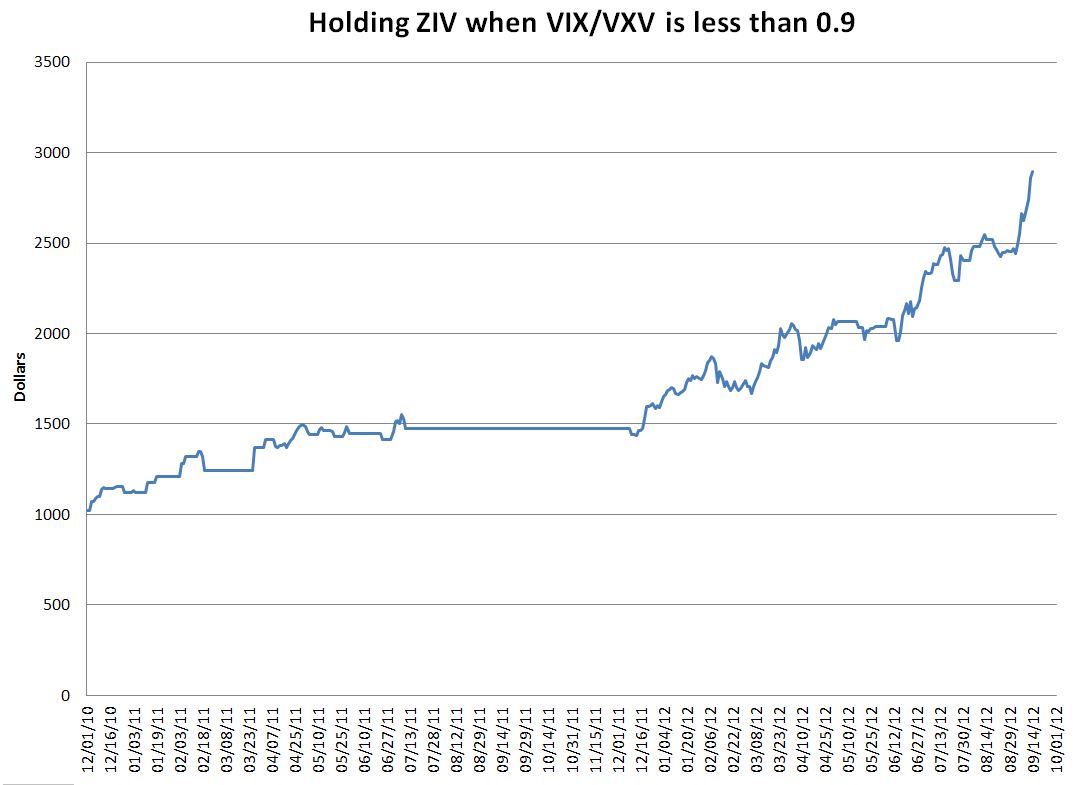
The strategy uses ZIV, VelocityShares’ medium-term inverse volatility ETN combined with the VIX/VXV ratio, an objective volatility measure, to switch between fully invested and cash. The backtest of this strategy starting at ZIV’s inception in 2010 is shown below:
ZIV with dynamic allocation
Annualized gain was 70%, maximum drawdown was 6%, and the Sharpe ratio was 9. The strategy switched allocations 41 times, or on average about once every two weeks.
ZIV takes an inverse position in 4 to 7 months VIX futures with daily rebalancing to maintain -1X tracking with the SPVXMTR medium term rolling index. This is essentially the index that Barclay’s popular VXZ medium term volatility fund follows. Medium term volatility funds are inherently less volatile than their short term cousins (XIV and SVXY).
While you’re probably familiar with the CBOE’s VIX index, the CBOE’s VXV index is relatively unknown. It uses the same methodology as the VIX index, except it’s computed for a 3 month expectation of volatility on SPX options, instead of 1 month.
The VIX/VXV ratio gives a simple way to evaluate the 1 to 3 month SPX implied volatility term structure without caring about the absolute values of the indexes. For example, if the ratio is below one the term structure is in contango, otherwise it is in backwardation.
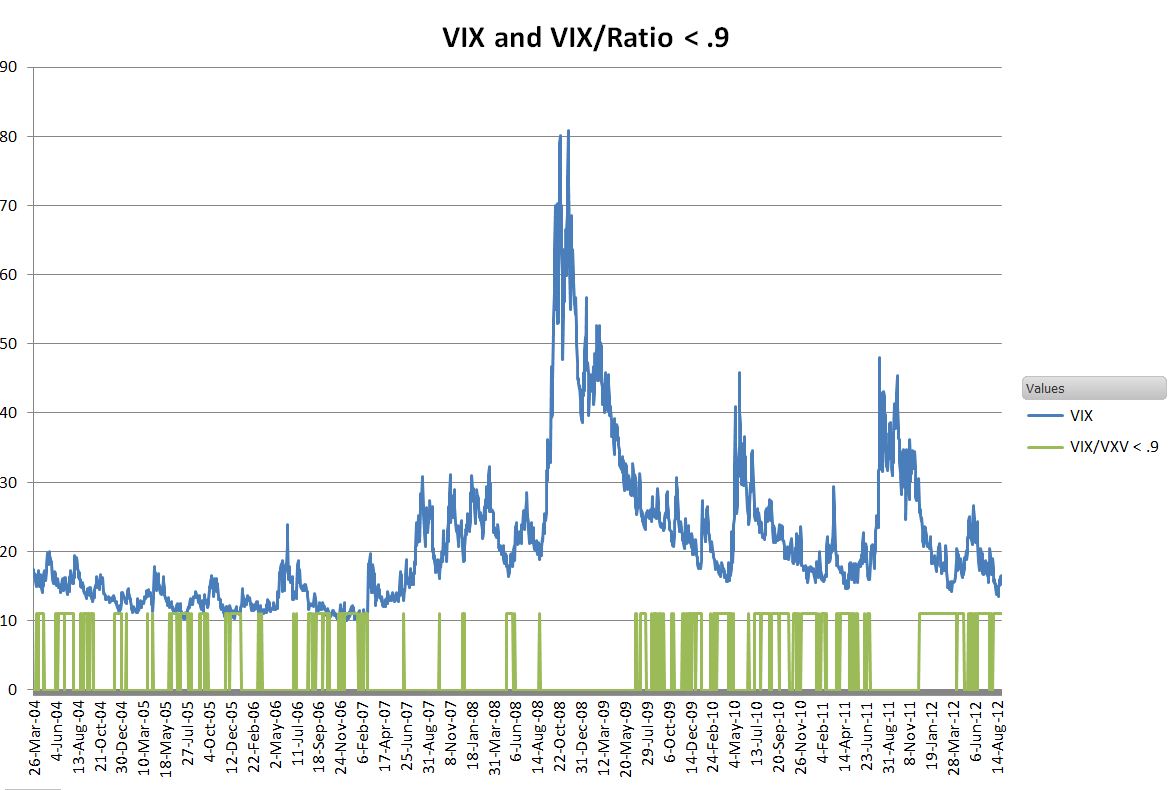
The allocation scheme I used triggers a shift into cash when the VIX/VXV ratio is 0.9 or higher. In practice this threshold is crossed when overall volatility is just beginning to pick up, or coming down after a long period of high volatility. This same 0.9 threshold is used by Barclays’ XVZ dynamic volatility fund to trigger a shift from its largest short volatility position to a slightly less short portfolio. The chart below shows this threshold compared to the VIX index itself: 
VIX and VIX/VXV
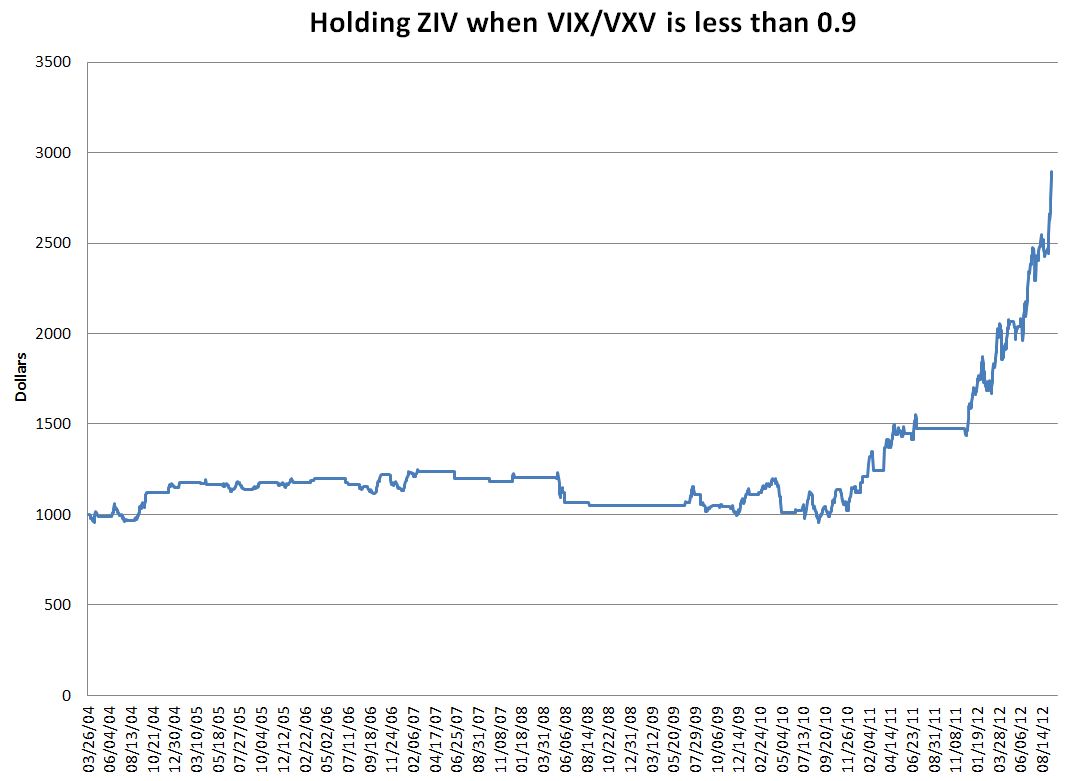
My initial backtest began in November 2010, but I was very curious what the earlier results of this strategy would have been, so it simulated this approach back to March 2004 using my ZIV backtest data. The results are shown below:
ZIV + ratio from 2004
Obviously something happened in 2010 that changed this strategy from going sidewise to 70% annualized growth.
It’s likely that something was medium term contango. The medium VIX volatility term structure began steepening 2010 (it recently hit historic highs). Increased levels of contango fuel this strategy.
With ZIV’s average daily volume running less than 5000, the liquidity pundits, will cry fowl, but my opinion is that liquidity in an Exchange Traded Product is driven by the underlying rather than the fund itself. With VIX volatility futures setting weekly records of volume and open interest I don’t think liquidity will be a problem. The bid/ask spread trends to be around $0.07, or 0.4%, I’d prefer a penny of course, but I’ve gotten good fills on substantial orders at or within the spread.
As with any strategy, the past results do not guarantee the future results. But for the time being, this strategy looks like a winner.
