One of the biggest misconceptions about the VIX and one that was further strengthened by the recent effects of the Financial Crisis, is its perceived inverse correlation with the given trend of the equity markets. Although we'd agree that correlations ebb and flow like the landscape backdrop of a meandering transcontinental train ride, for us the VIX appears to be bearing a position just beyond the Great Plains - and beginning to make its way up towards the majestic heights of another Great Continental Divide.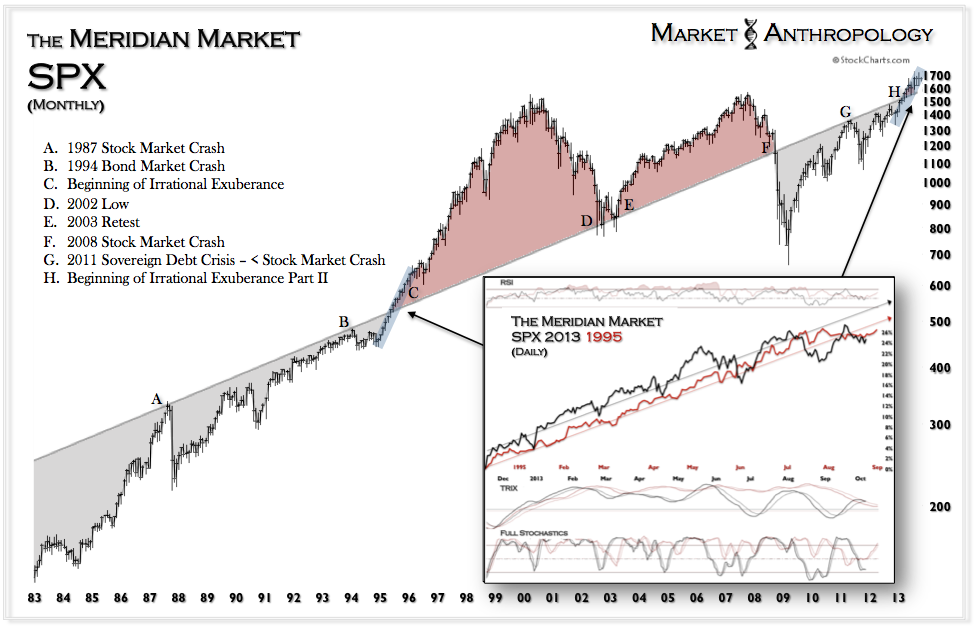
The first Meridian breakthrough in 1995 is a good example of where the polarity of the VIX flipped as it began trending higher with the equity markets. With hindsight 20/20, it was a good indication that the underlying market psychology was again adding to the critical wall-of-worry, as equity markets pushed into what many participants at the time had thought was already very thin air. The surprising reality was that the VIX would trend higher with markets for over six years on their way to another great market divide in 2000.
While we can't quite speculate how long the ride will take this time around or how high the peak could rise for the equity ranges, one could argue the relatively recent shift this spring (expressed in the VIX) in underlying skepticism tells us most participants still have a bewildered bearing. To us this would indicate a significant long-term summit isn't on the horizon - yet.
A few thoughts
The VIX made a cycle low in December 1993, directly before the Fed began removing the accommodative monetary policies introduced during the financial crisis that culminated in 1990. While not quite an apples to apples structural comparison, we still believe the introduction of the taper this spring was the markets psychological equivalent of the rate hikes by the Fed that began in 1994. 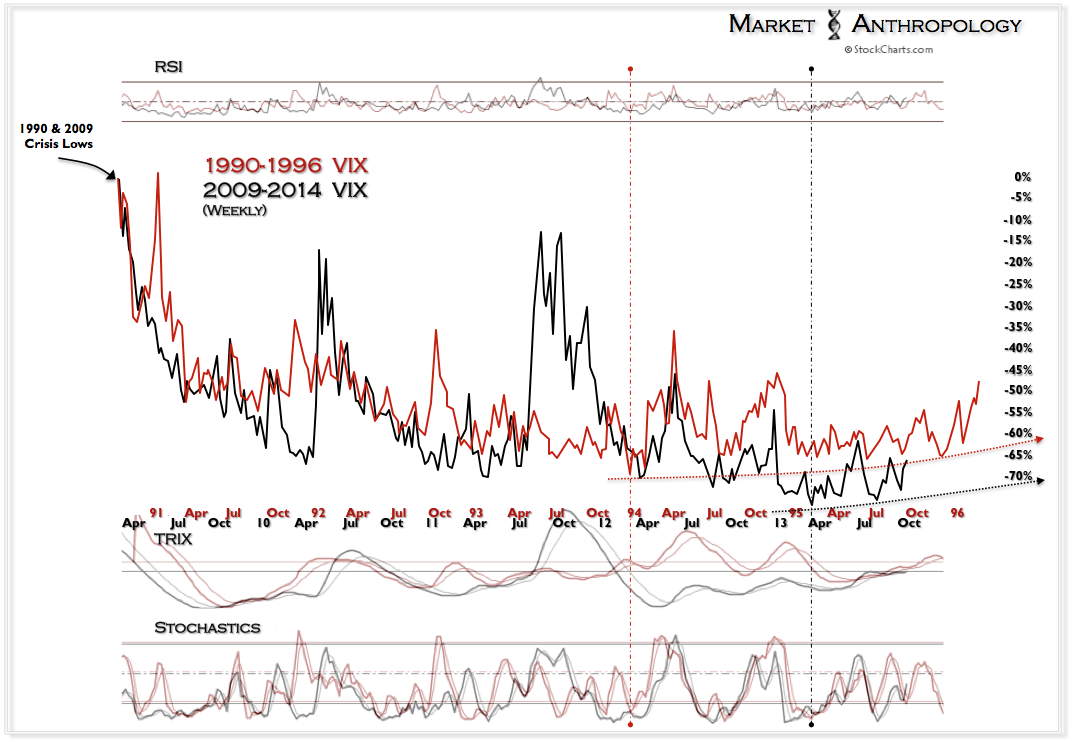
Taper-talk introduced by the Fed closed the performance differential between the TNX:SPX ratio and the previous cycle. At this point, we do not expect a market dislocation on the magnitude of 1994, and see the ratio once again following the previous cycles trend lower.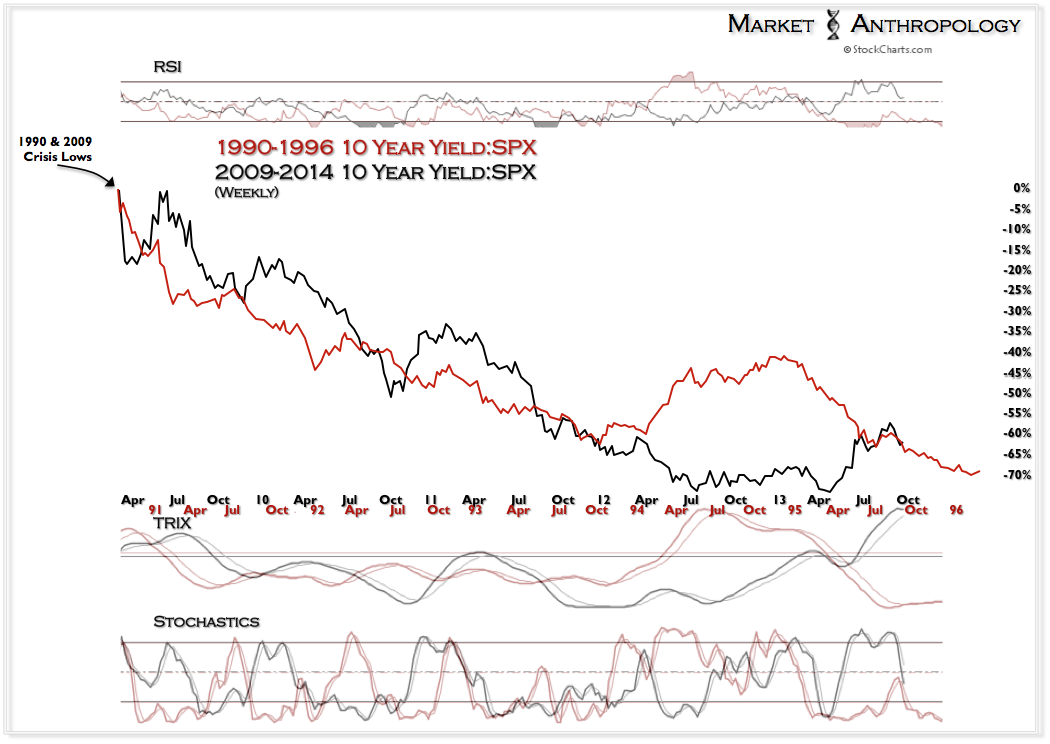
As we have pointed to, performance benchmarks between the two cycles - even for the historic Nasdaq climb, are quite similar. 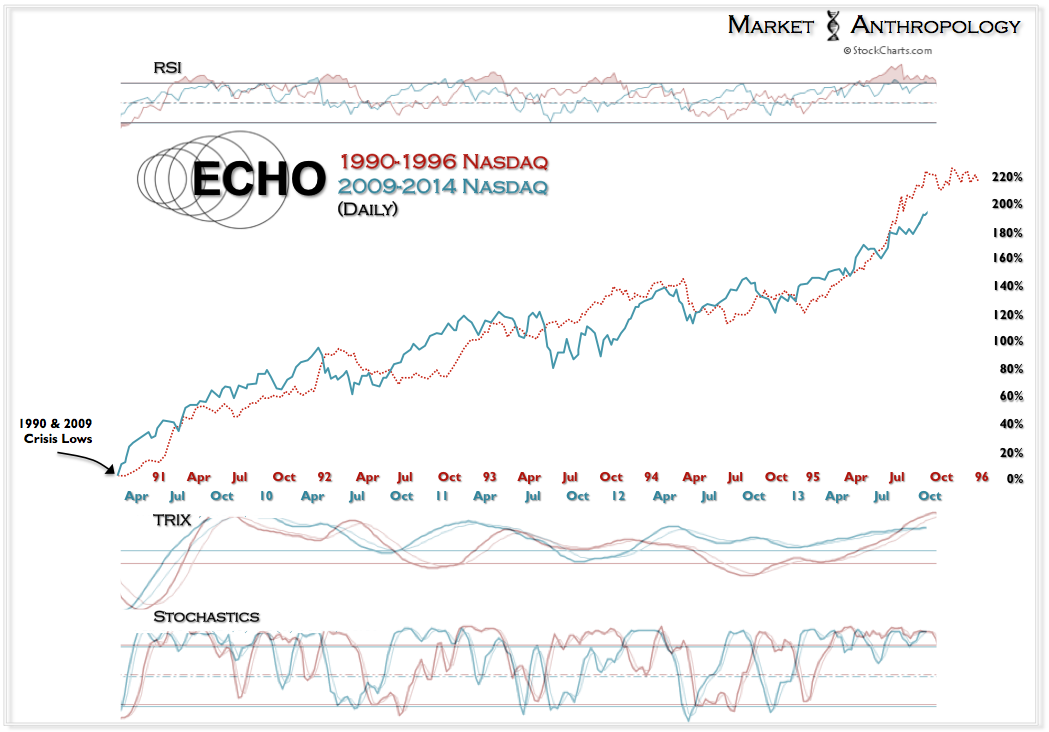
However, worth noting is that for a higher beta index such as the Nasdaq, it has not been such a large performance outlier as it was during the 1990's. This is due to several factors, such as a stronger reflexive bounce out of the crisis lows for the SPX this time, because the magnitude of losses realized in the financials were so disproportionately greater. With that said, we would argue the equity markets are structurally more balanced this time around.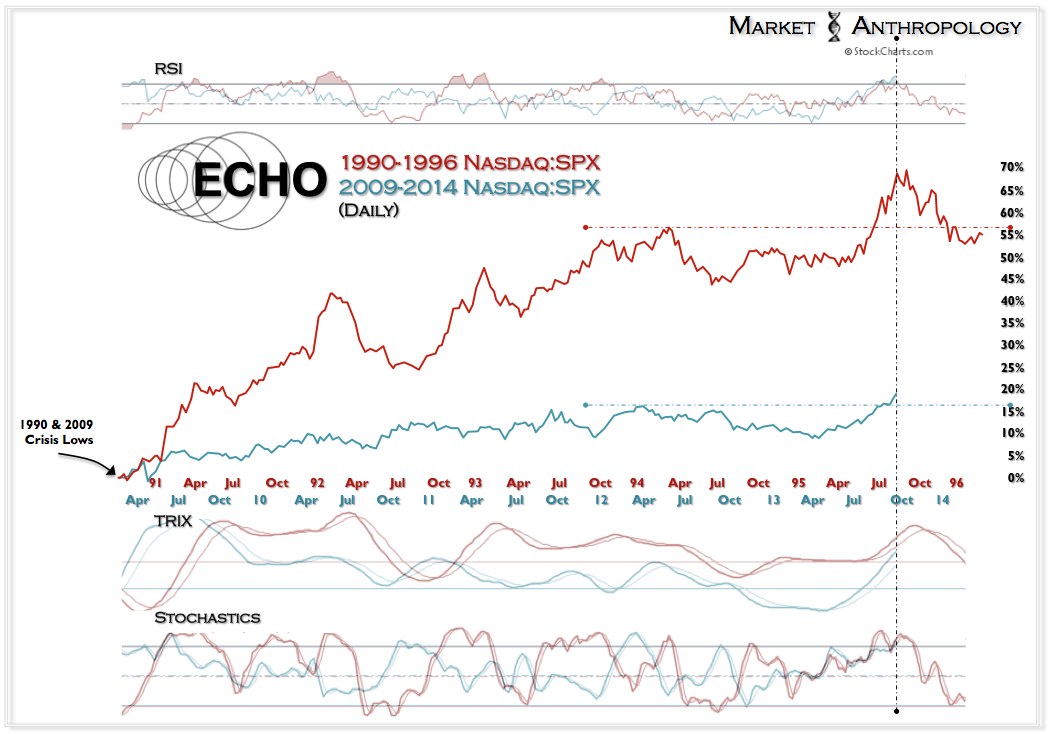
- English (UK)
- English (India)
- English (Canada)
- English (Australia)
- English (South Africa)
- English (Philippines)
- English (Nigeria)
- Deutsch
- Español (España)
- Español (México)
- Français
- Italiano
- Nederlands
- Português (Portugal)
- Polski
- Português (Brasil)
- Русский
- Türkçe
- العربية
- Ελληνικά
- Svenska
- Suomi
- עברית
- 日本語
- 한국어
- 简体中文
- 繁體中文
- Bahasa Indonesia
- Bahasa Melayu
- ไทย
- Tiếng Việt
- हिंदी
Taking A Transcontinental Ride On The VIX
Published 10/07/2013, 01:34 AM
Updated 07/09/2023, 06:31 AM
Taking A Transcontinental Ride On The VIX
Latest comments
Loading next article…
Install Our App
Risk Disclosure: Trading in financial instruments and/or cryptocurrencies involves high risks including the risk of losing some, or all, of your investment amount, and may not be suitable for all investors. Prices of cryptocurrencies are extremely volatile and may be affected by external factors such as financial, regulatory or political events. Trading on margin increases the financial risks.
Before deciding to trade in financial instrument or cryptocurrencies you should be fully informed of the risks and costs associated with trading the financial markets, carefully consider your investment objectives, level of experience, and risk appetite, and seek professional advice where needed.
Fusion Media would like to remind you that the data contained in this website is not necessarily real-time nor accurate. The data and prices on the website are not necessarily provided by any market or exchange, but may be provided by market makers, and so prices may not be accurate and may differ from the actual price at any given market, meaning prices are indicative and not appropriate for trading purposes. Fusion Media and any provider of the data contained in this website will not accept liability for any loss or damage as a result of your trading, or your reliance on the information contained within this website.
It is prohibited to use, store, reproduce, display, modify, transmit or distribute the data contained in this website without the explicit prior written permission of Fusion Media and/or the data provider. All intellectual property rights are reserved by the providers and/or the exchange providing the data contained in this website.
Fusion Media may be compensated by the advertisers that appear on the website, based on your interaction with the advertisements or advertisers.
© 2007-2025 - Fusion Media Limited. All Rights Reserved.
