I recently returned from India, a nation where an incredible 600 million people are under the age of 25. That’s nearly double the entire population of the U.S.!
What’s amazing about that figure is that, unlike the 1970s when India had no global footprint, today’s generation is increasingly gaining access to the Internet.
Social networking platforms are seeing an incredible growth trajectory in India, as one of the fastest growing markets. In fact, by 2016, the country is set to be Facebook’s largest population in the world, according to the BBC.
While Forbes India reports that there are only 137 million users in India, with the growing population and rising wealth, we expect this number to grow substantially.
I believe this connectivity changes the growth pattern for commodities. Like I told Kitco’s Daniela Cambone at the Metals & Minerals Investment Conference in San Francisco, this population carries on its love of gold. Mineweb reports that about 1 million couples will marry this wedding season, with around 33,000 weddings taking place on November 19 alone.
Gold traditionally accompanies these events, and a typical gift is “a pendant, earrings or a ring, weighing 5-10 grams depending on financial circumstances. Parents of the bride generally give heavier items like a necklace or bangles weighing 50 grams or more,” according to Mineweb.
Still, to help manage expectations, investors should anticipate a short-term headwind for the precious metal as India’s GDP per capita has stalled. The World Bank estimated India to grow 6.1 percent this year, but lowered its forecast to 4.7 percent due to a slowdown in manufacturing and investment.
The long-term picture looks positive though. While India grew at 4.8 percent in the third quarter, the finance ministry is confident the country can return to its “high-growth plan.” It projects the economy to pick up, accelerating to around 6 percent in the next fiscal year and about 8 percent in another two years, says The Wall Street Journal.
India’s growing GDP is very important to gold’s rise, especially when it comes to the Love Trade, where about 50 percent of the world’s population buys gold out of love. The math shows that an increasing GDP per capita in this part of the world has historically been linked to the rising price of gold.
Related to the Fear Trade—buyers holding the metal out of fear of poor government policies—gold has recently become less attractive due to the slightly positive real interest rates in the U.S.
As we explain in our Special Gold Report on the Fear Trade, one of its strongest drivers is real interest rates, which is when the inflationary rate of return is greater than the current interest rate.
Our model tells us that a real interest rate of more than 2 percent is typically bearish for gold.
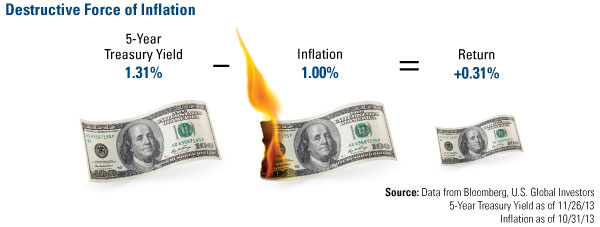
Still, the real rate is not very close to the 2 percent tipping point. As of the end of November, the 5-year Treasury yield is 1.31 percent while inflation is at 1 percent. Investors end up with a slightly positive return of 0.31 percent. With onerous regulations continuing to slow down the flow of money, I believe the government will need to keep its printing presses warm, eventually reigniting the Fear Trade.
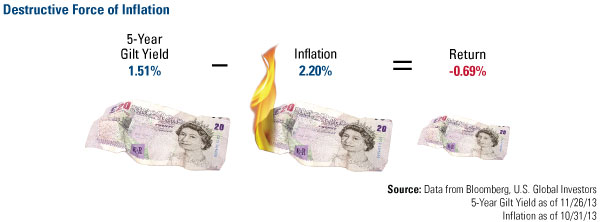
Keep in mind that real rates are not positive in every country. As I will be showing in my presentation at the Mines and Money conference in London, U.K. investors are still losing money after inflation. The 5-year gilt yield is at 1.51 percent, but inflation is at 2.2 percent, resulting in a negative real rate of return.
What Are You Thankful For?
The holiday season is a good time to give gratitude for our loved ones.
Here’s one more thing investors can be thankful for: The nearly 30 percent return in U.S. stocks so far this year.
This is despite Americans being bombarded with negative messages of the health care reform. TIME printed a busted “Obamacare” pill accompanied by the headline, “Broken Promise: What It Means for This Presidency.” The Economist features an image of President Barack Obama sinking in water with the headline, “The man who used to walk on water.” This November, Obama’s approval rating sank to a new all-time low.
While the government may not be functioning well right now, there is a lot that is working well in America. The stock market reflects that, even though the headlines don’t.
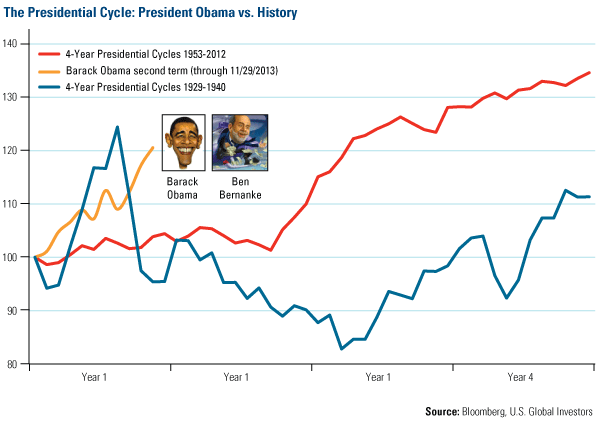
Take a look at the chart below, which shows President Obama’s second-term presidential cycle in comparison with 4-year presidential cycles from 1929 through 1940 and the presidential cycles from 1953 through 2012. The current cycle beats both of the historical trends.
To me, the chart indicates that investors who ignore the negative headlines and focus on the strength of the U.S. stock market are the ones who have been very profitable this year. When it comes to investing, what are you thankful for?
All opinions expressed and data provided are subject to change without notice. Some of these opinions may not be appropriate to every investor. The S&P 500 Index is a widely recognized capitalization-weighted index of 500 common stock prices in U.S. companies. The Consumer Price Index (CPI) is one of the most widely recognized price measures for tracking the price of a market basket of goods and services purchased by individuals. The weights of components are based on consumer spending patterns.
