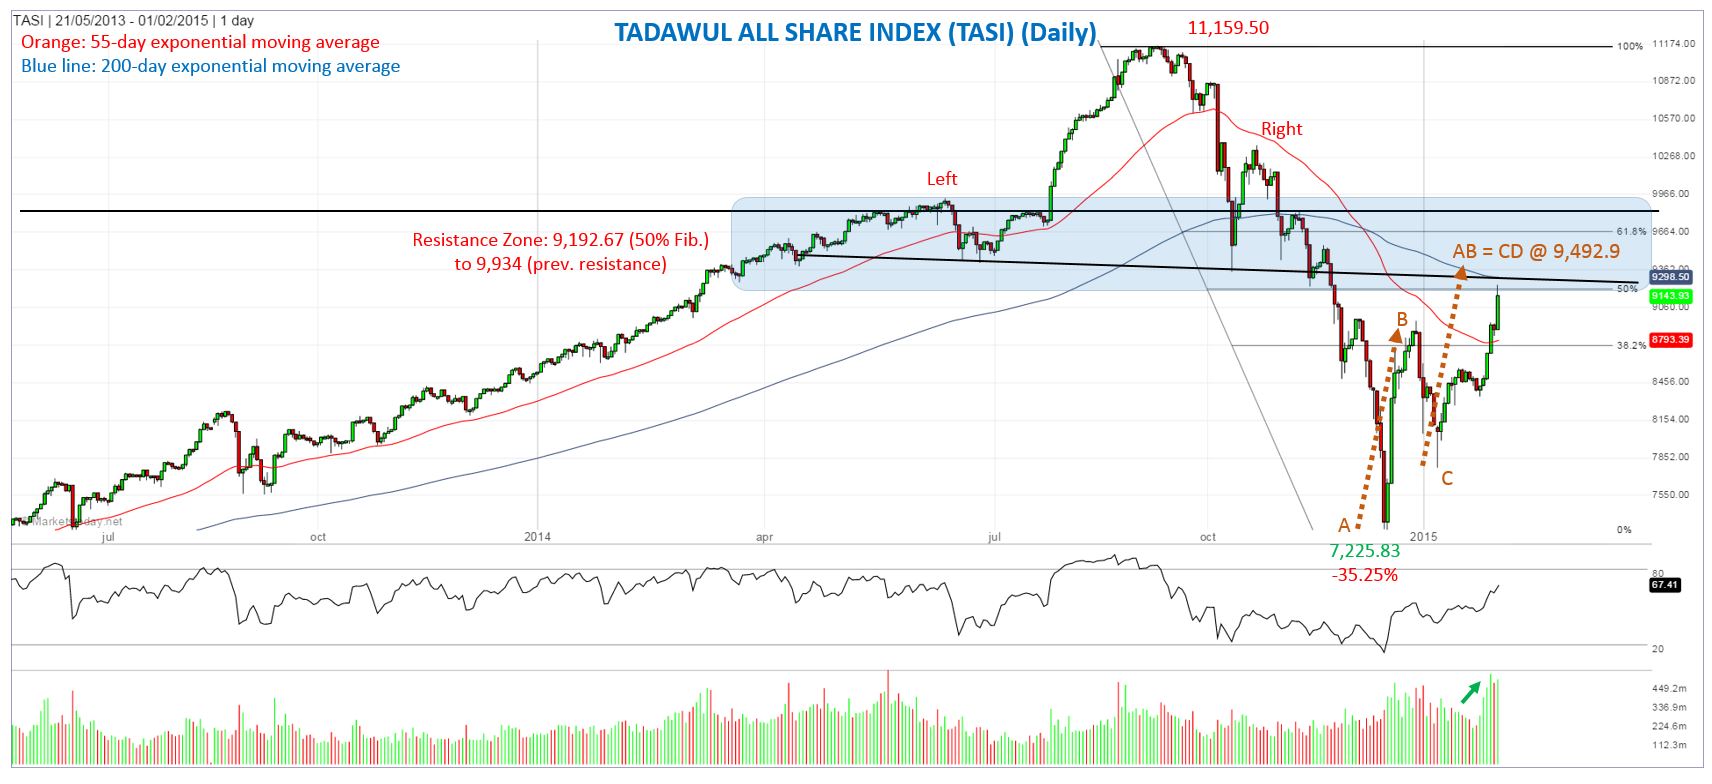
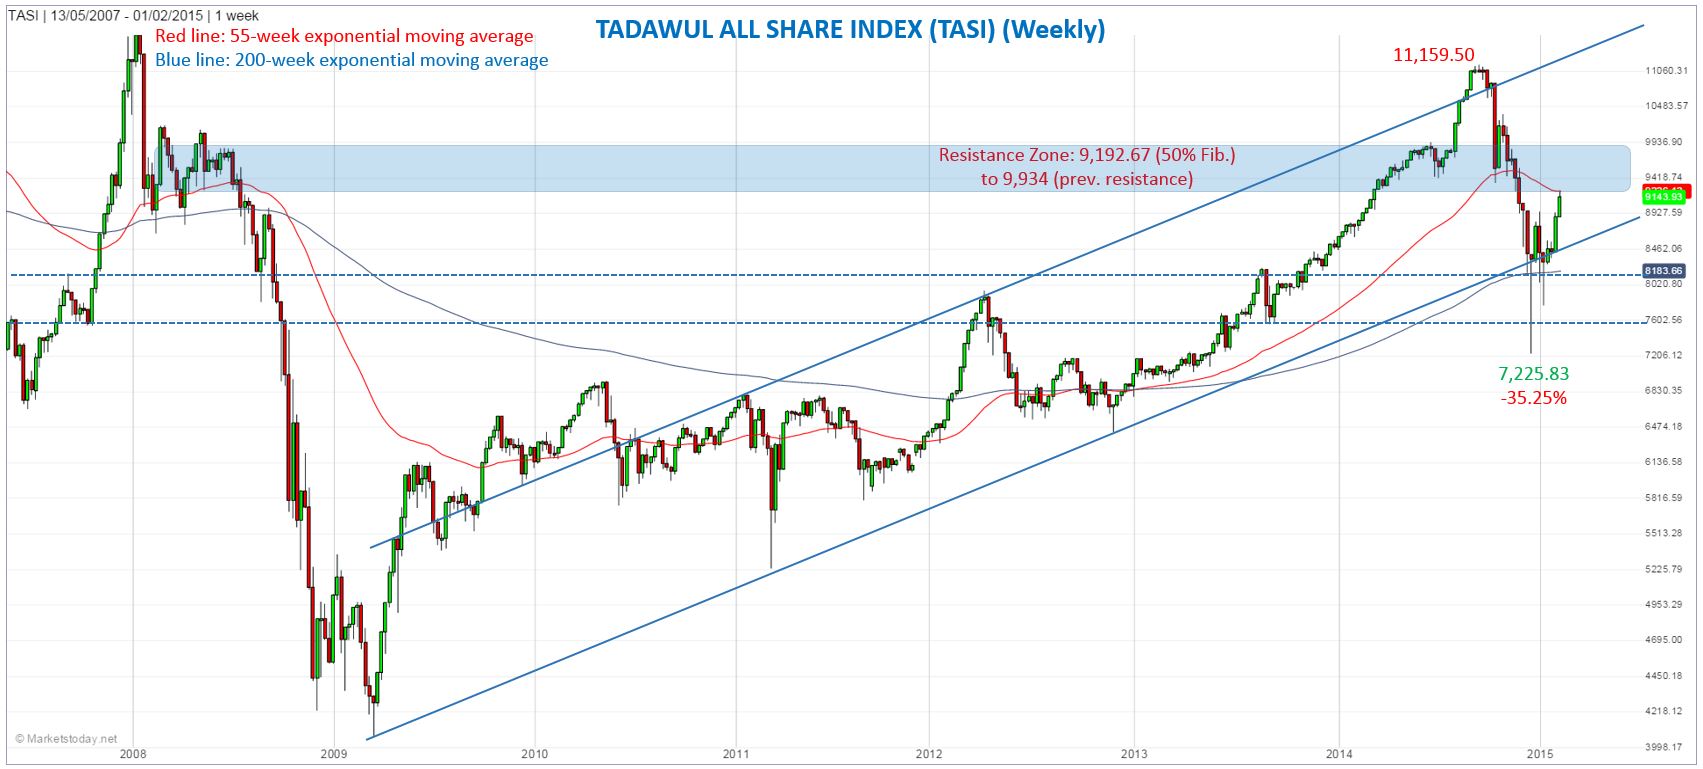
Yesterday, the Tadawul All Share Index (TASI) touched the bottom of a relatively large potential resistance zone (approx. 9,192.67 to 9,934) upon completing a 50% retracement (9,192.67) of the full downtrend, as measured from the 11,159.50 peak that was hit in September 2014. Meanwhile, resistance of the 55-week exponential moving average (EMA) at 9,226.12 was also hit.
For the day, the TASI gained 2.99%, reaching a high of 9,238.41 and ending at 9,143.93.To date, the index has advanced as much as 27.9% off the corrective low of 7,225.83 from December of last year.

Although the TASI could stall and pull back from here, there are also some bullish signs that could take the index a bit higher. A continuation of the seven-week uptrend was triggered yesterday as the 8,948.52 peak from five weeks ago was exceeded. In addition, an AB=CD pattern has been developing and the initial target has not been reached. An AB=CD pattern is a measured move where the second leg up matches the price distance of the first leg up, reflecting symmetry between market moves. The beginning of the second leg up starts from the swing low of 7,770.17 hit four weeks ago, with a target of 9,492.90.

Technical Summary:
- 9,192.67 (50% retracement) to 9,934 (prior resistance peak): Large resistance zone
- 9,226.12: 55-week ema
- 9,298.5: 200-day ema (matches neckline resistance of a head and shoulders top formation)
- 9,400 to 9,700: Prior weekly resistance or support over nine weeks during seven months in 2014 (61.8% Fibonacci retracement at 9,656.84 is close to the high of this range)
- 9,492.9: AB=CD (100%)
- 9,961.4: AB=CD (CD = 127.2% Fibonacci extension of the first leg)
- RSI, measuring momentum,is now at 67.41 - not yet overbought (above 70)
- Daily Volume has been increasing over the past week as the TASI rallies
