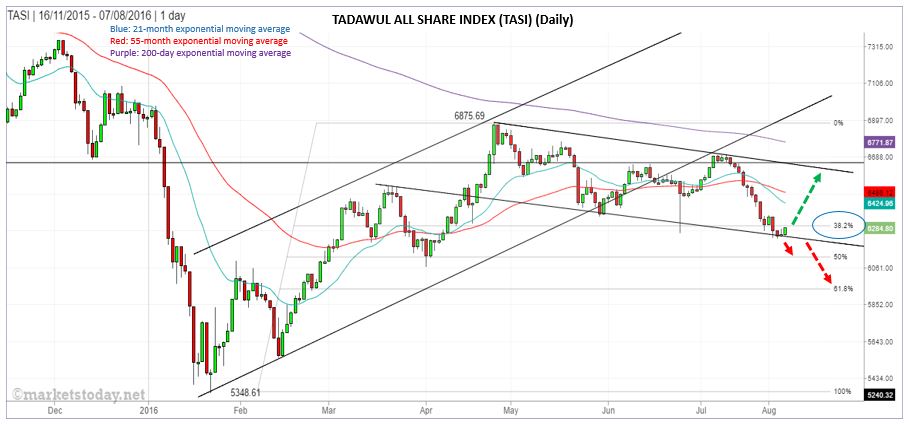
The Tadawul All Share reached a high of 6,875.7 for 2016 in late-April and has since been retracing the 28.6% advance off the five-year low of 5,348.61 reached in January. As of last week’s low of 6,226.4 the TASI has pulled back 9.4% from the 2016 high,and completed a 38.2% Fibonacci retracement two weeks ago at 6,292.3. When looking at Fibonacci analysis, a 38.2% retracement is the minimum retracement anticipated before the initial trend may again kick in.

During the retracement a relatively well formed descending trend channel has formed and the lower trend line has been support for the past two weeks. The odds now favor a rally towards the top trend line of the channel, in the approximate area of 6,647.
However, if last week’s low is broken to the downside the TASI heads first towards the 50% retracement zone around 6,112.2, followed by the 61.8% Fibonacci retracement level at 5,932.
Note that that long-trend remains down with the 200-day exponential moving average (ema) (purple) on the daily chart doing a good job of defining resistance of the downtrend so far. It is currently at 6,771.83. A daily close above the 200-day emawill begin to improve the intermediate-term outlook for the TASI.
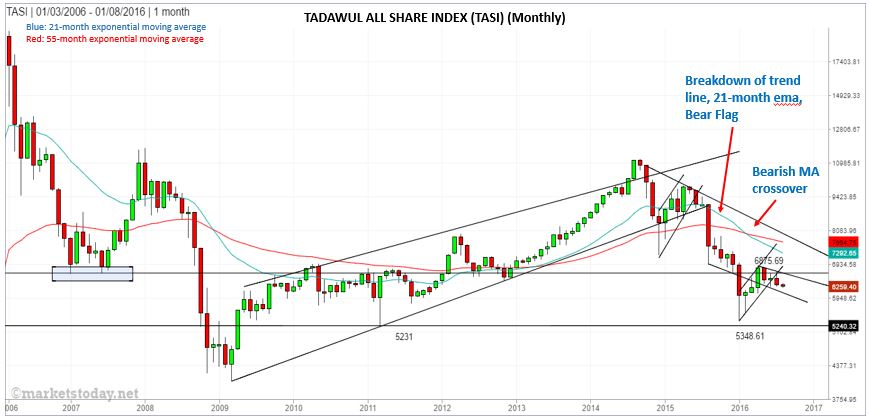
This next monthly chart gives some perspective as to the long-term bearish pattern in the TASI.
