Weekly Chart
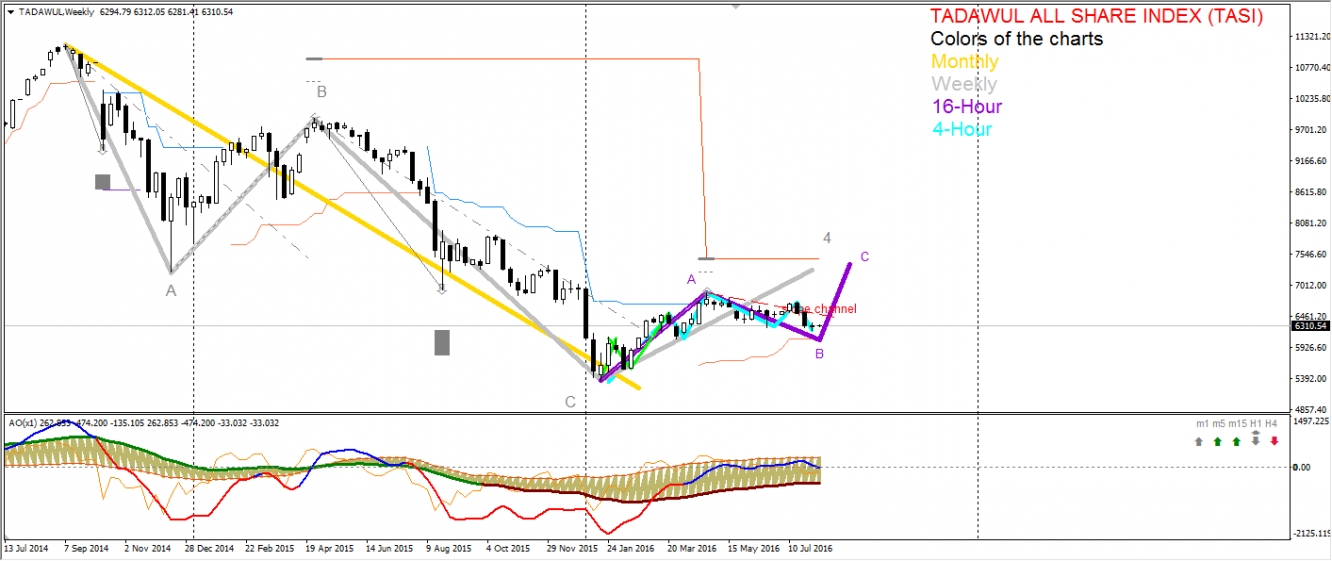
The Tadawul All Share (TASI) entered the bearish downtrend in September 2014 and lost half of its value by January 2016. On the weekly chart below we may see a 3-wave ABC structure plotted with grey lines within the downtrend.
The recent bullish retracement may be considered as the 4th correction wave to be followed by the 5th momentum wave restoring the previous downtrend.
16-Hour Chart
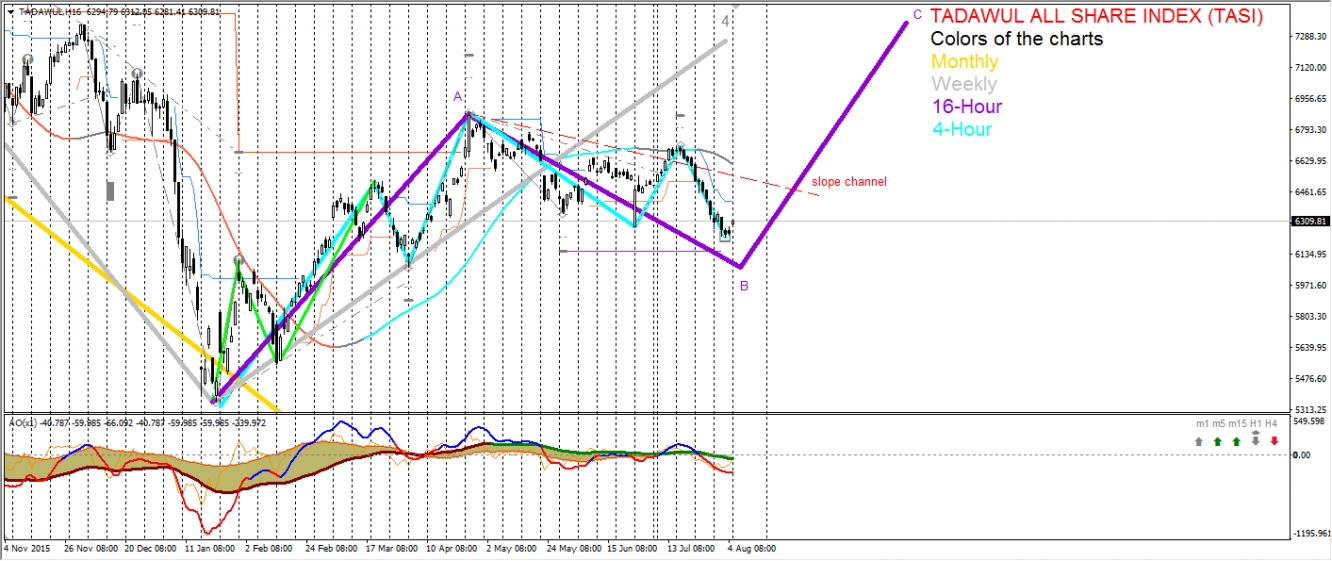
If we study this bullish correction on the 16-hour chart, we may notice the 2 major moves that are highlighted by violet lines: the A or the 1st impulse bullish wave from January till April and the corresponding B or 2nd wave that is developing now.
The 16-hour chart advises to expect the 3rd or the C momentum bullish move. However, as the A wave of latest retracement was a very long and took 4 months to complete, the current B correction will also turn into an extended and complex wave.
How could we know that the B correction is over and bulls are ready to take revenge by starting a momentum C wave up? One of the key factors to watch is a red dashed slope channel. Until it remains intact, the B correction is still running on.


