Harry Browne proposed a “Permanent Portfolio” allocation in his 1998 Fail-Safe Investing: Lifelong Financial Security in 30 Minutes. Browne proposed an equal-weight portfolio of stocks, long-term bonds, cash, and gold. One of the major appeals of the portfolio is its simplicity and the low correlation between the assets. Today an investor could create this portfolio using as little as four ETFs: SPY (SPDR S&P 500 ETF), TLT (iShares Barclays 20+ Year Treasury), SHY (iShares Barclays 1-3 Year Treasury Bond Fund), and GLD (SPDR Gold Trust). Holding four low-cost ETFs and re-balancing periodically can help minimize trading costs and potential tax implications while also providing diversity.
Top 50 Trending Stocks
In February 2012 I back-tested the Permanent ETF Portfolio (SPY, TLT, SHY, and GLD) and some minor variations of the portfolio, with the results available here. The conclusion reached then was “the portfolio has had relatively low drawdown and volatility with recent returns outpacing equity markets. The 10 month moving average system lowered the volatility of the portfolio…but had slightly lower overall returns than simply buying and holding the portfolio.” The moving average system also results in higher trading costs and potential tax implications.
Today we will re-examine the same strategies detailed in February as well as additional tactical applications of the Permanent Portfolio. The time-frame for all tests is January 3rd 2005 to August 23rd, 2012. All tests were conducted using ETF Replay.
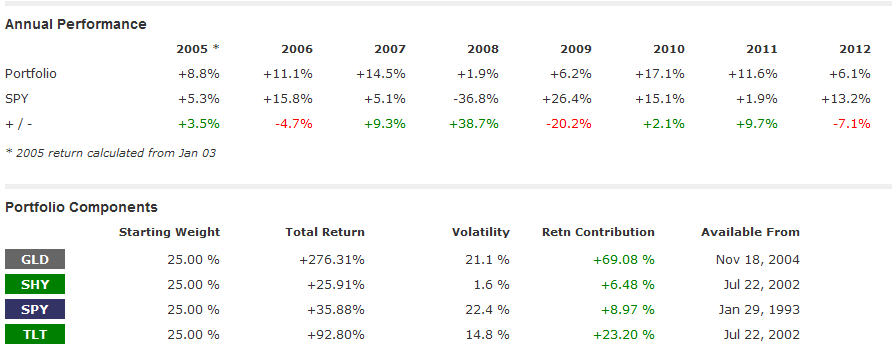
First, buying the ETF version of the Permanent Portfolio on January 3rd, 2005 with no re-balance has resulted in the following returns: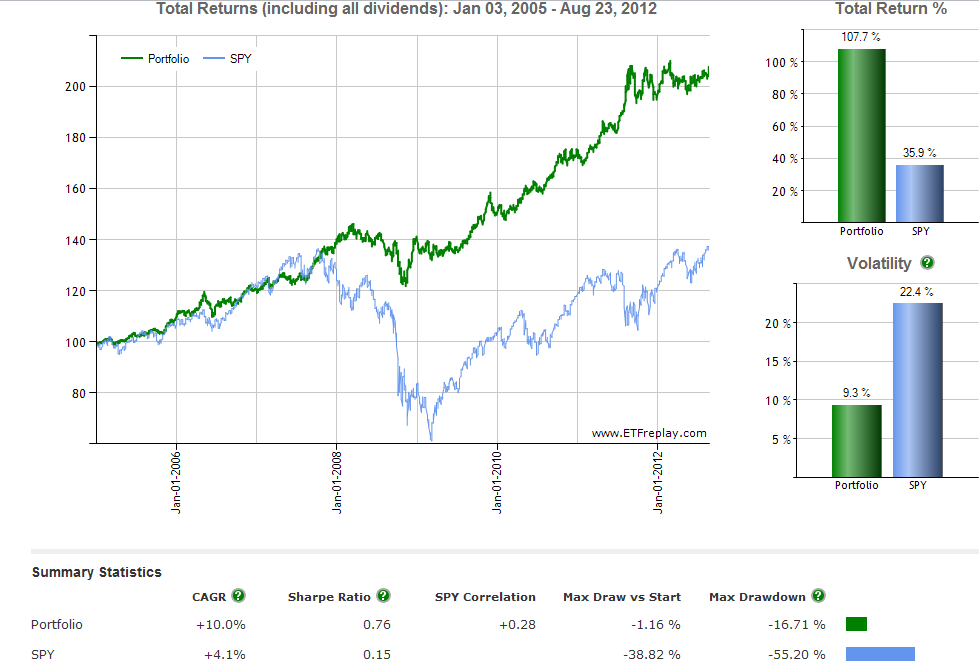
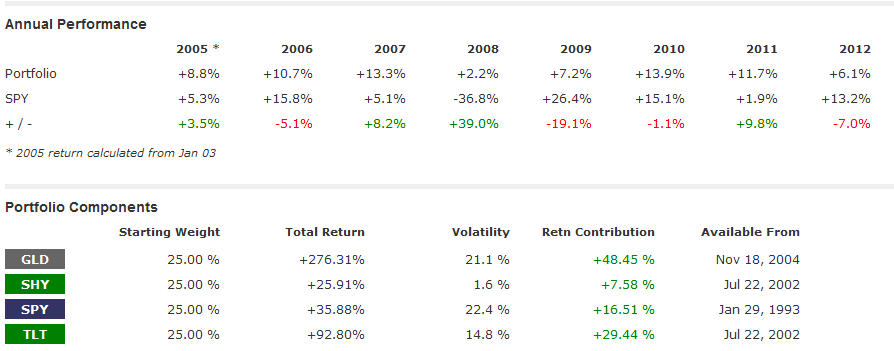
If we bought the portfolio and re-balanced annually, total returns decreased slightly versus the “no re-balance” portfolio but volatility decreased, resulting in a higher sharpe ratio and lower max drawdown: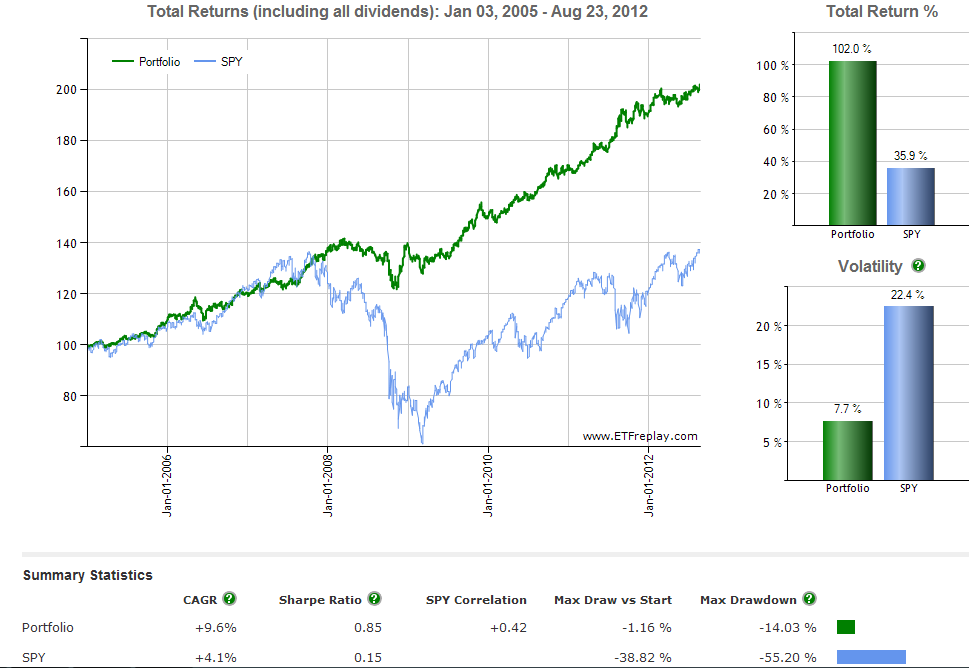
The 10 month simple moving average system has been popularized in recent years by Mebane Faber in The Ivy Portfolio: How to Invest Like the Top Endowments and Avoid Bear Markets. For the tests below when an ETF in the portfolio was below its 10 month moving average at month-end, the position was sold and held in “cash” (SHY was used as a substitute for cash). When it closed the month above its 10 month moving average, the ETF was purchased at the stated allocation.
The performance for the 10 month moving average system within the 4 ETF permanent portfolio is below. GLD did not have adequate trading history at the start of 2005 to generate a 10 month moving average, so the results are slightly skewed until GLD generated a signal in mid 2006.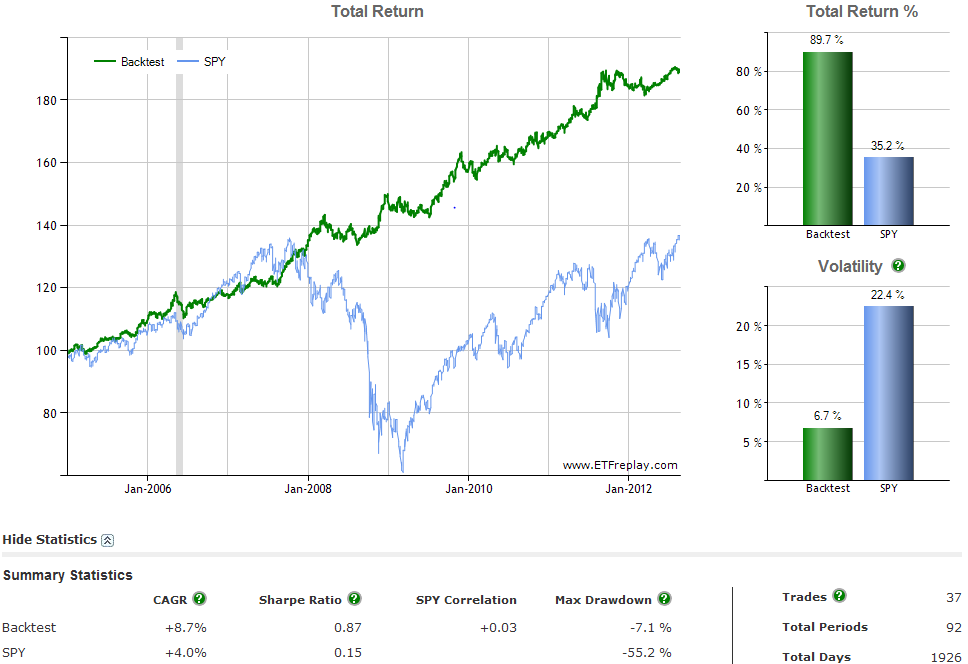
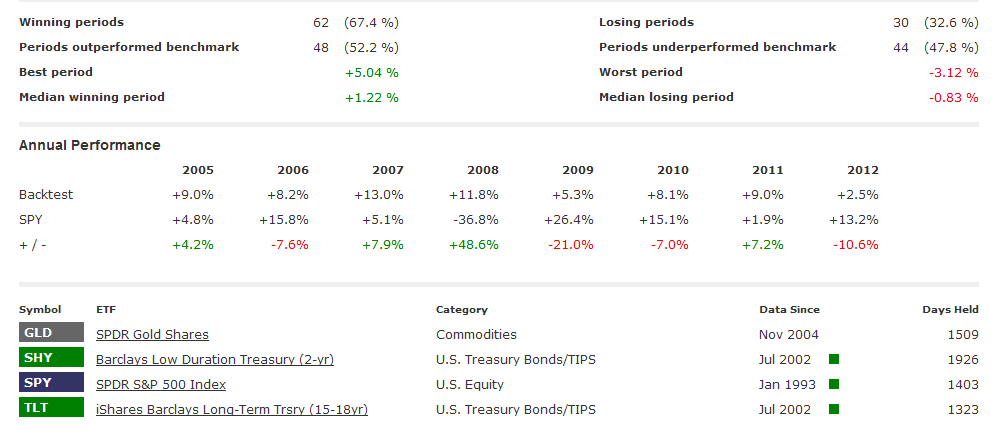
The moving average system has resulted in lower total returns but lower volatility, resulting in a slightly higher sharpe ratio than the first two strategies. However, this comes at potentially higher trading costs and tax implications. There were 37 trades since 2005 using the 10 month moving average, which equates to roughly 5 trades per year. When compared to an annual re-balance strategy that potentially requires 4 year end trades, the moving average system still has relatively low turnover for an active strategy.
A potential momentum strategy for the Permanent Portfolio is to purchase the top 1 or 2 ETFs of the 4 based on relative strength. For the tests below the ETF with the top 6 month relative strength is purchased and held for a month. The returns when purchasing the top 1 ETF each month are below: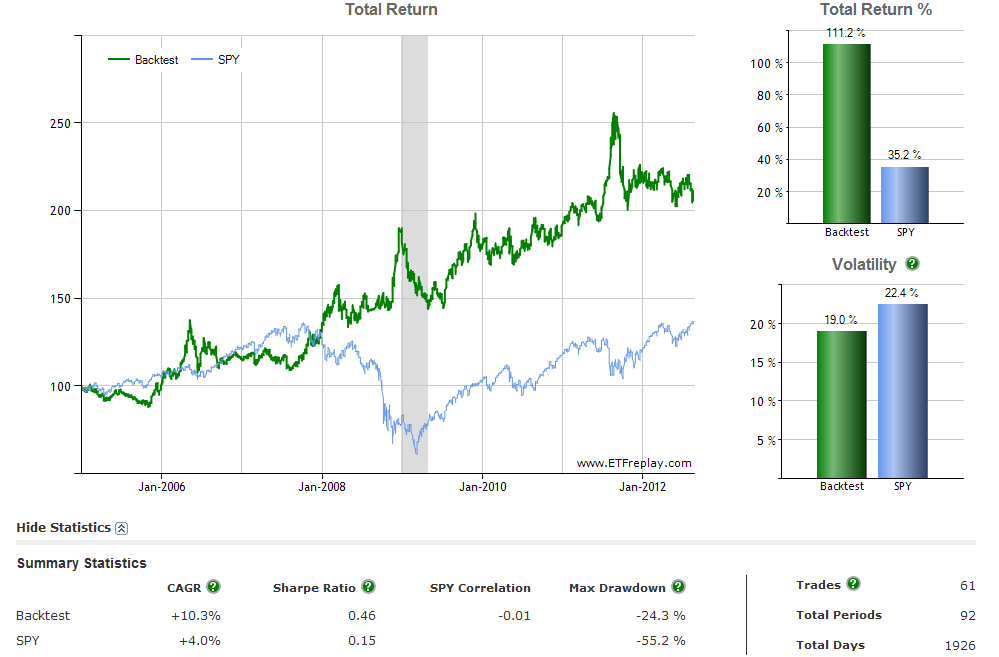
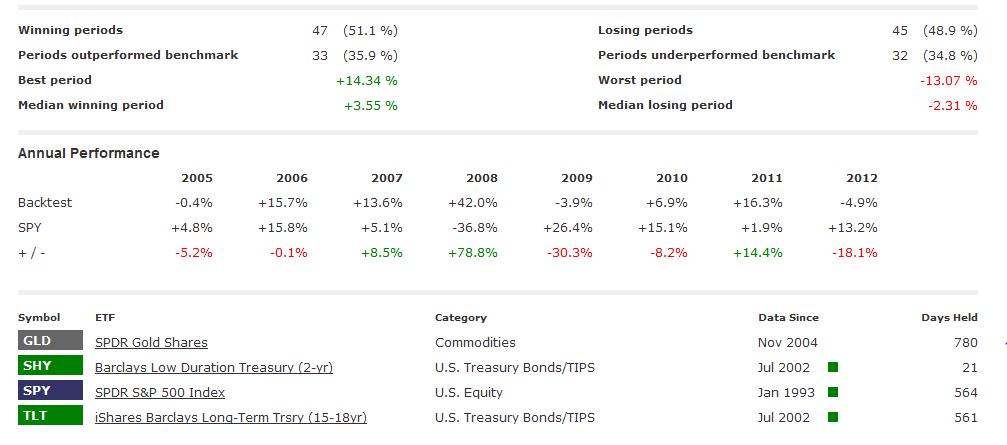
The returns for the top 1 ETF strategy has resulted in substantially higher volatility and comparable returns to a buy-and-hold strategy. In addition, the strategy had 61 trades since 2005.
However, the historical results for purchasing the top 2 ETFs are much more promising: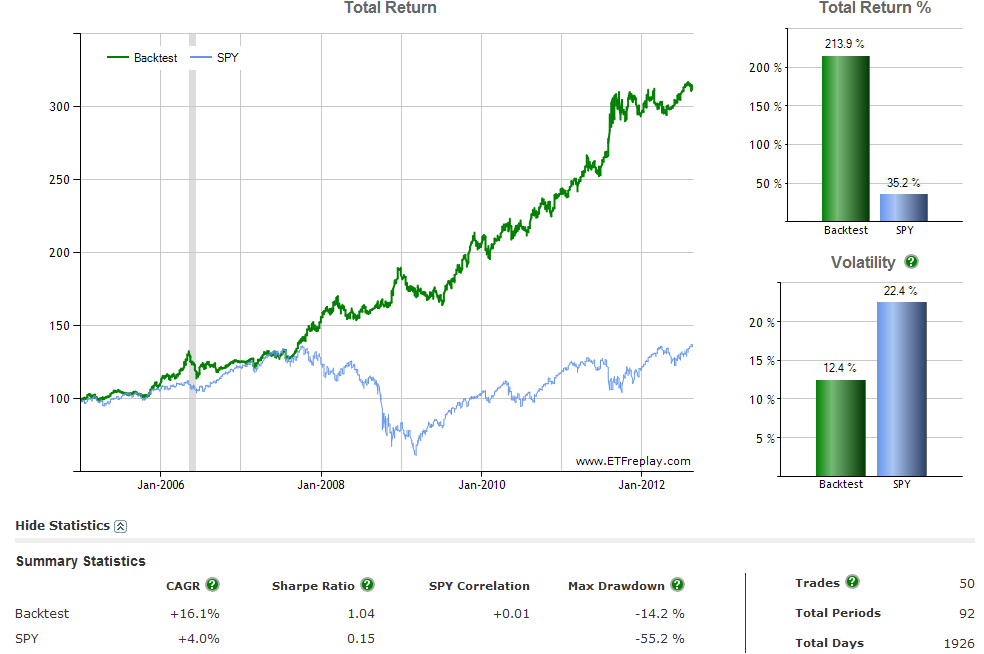
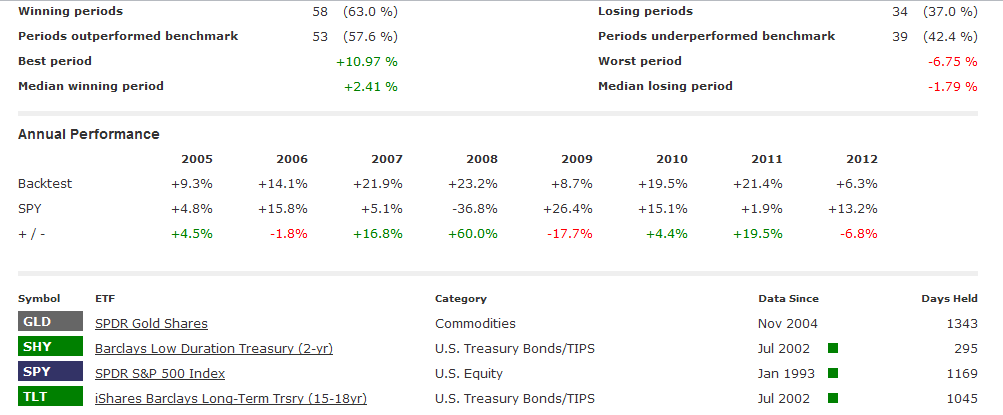
A relative strength system that purchased the top 2 ETFs has resulted in substantially higher returns versus the top 1 system. The strategy resulted in 50 trades or an average of 6-7 trades per year.
Additional strategies an investor could use would be to allocate a percentage of funds to each strategy. For example, if we allocate 50% of a portfolio to the 10 month moving average system and 50% to the 6 month top 2 relative strength system, the results are below: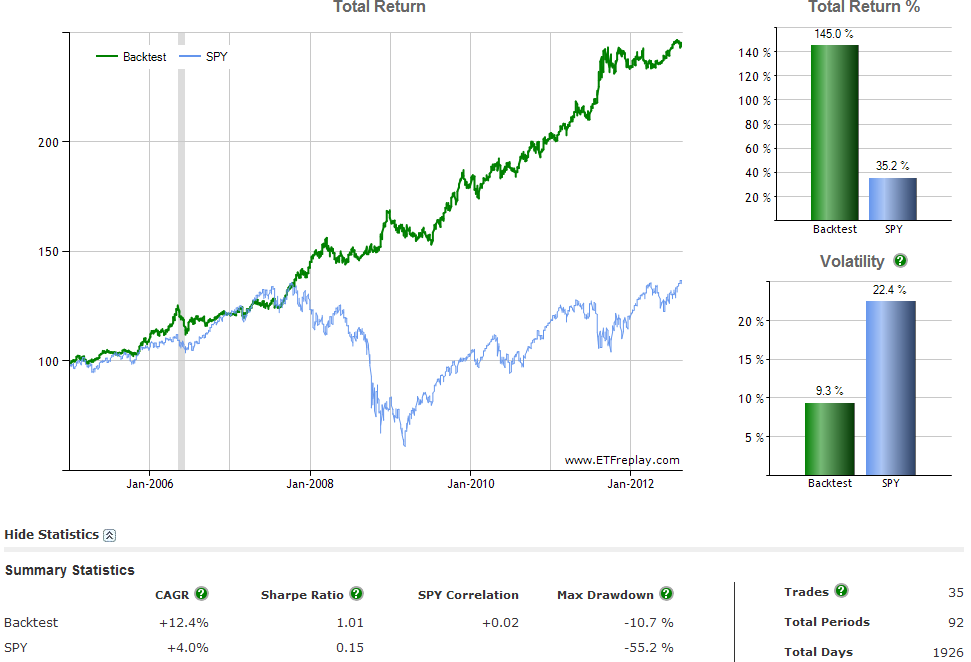
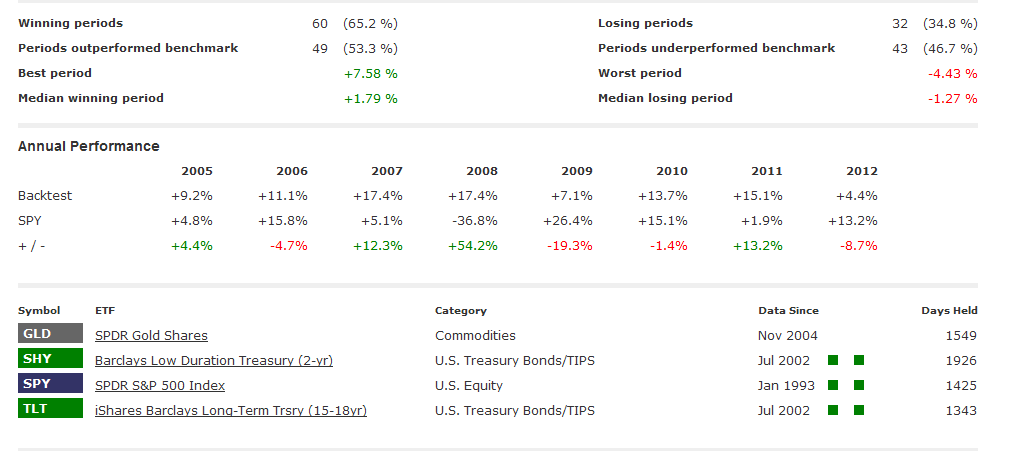
As you can see, returns and the sharpe ratio were better than buy-and-hold but again it comes at higher turnover.
Below is a table comparing the various strategies tested above: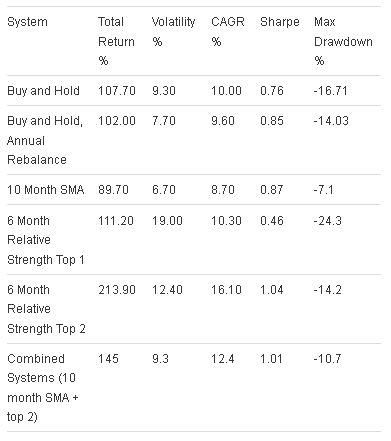
Simple tactical approaches like the ones detailed above offer viable alternatives to investors nervous about buying-and-holding the portfolio over the long run. For example, someone may be nervous about the direction of long-term rates and the potential for losses in TLT in the coming years. A simple moving average system and relative strength system could help reduce exposure to asset classes when they display weakness.
These systems come at potentially higher trading costs and tax implications. Also, a systematic approach can be difficult for some investors to follow – we may allow the outside “noise” to interfere with the signals of our investment system. In doing so, we can actually hurt our long-term returns when compared to the original system or a buy-and-hold approach.
Key takeaways are threefold, 1) Buying and holding the Permanent Portfolio the past 8 years has resulted in strong risk-adjusted returns 2) Tactical approaches have offered slightly higher risk-adjusted returns and in some cases total returns, but with higher trading costs, 3) There is no guarantee any of the systems detailed above will perform well in the future. For example, a rise in long-term interest rates coupled with an equity market malaise or a collapse in the price of gold combined with either of the two could impact the strategy’s ability to outperform in the future.
- English (UK)
- English (India)
- English (Canada)
- English (Australia)
- English (South Africa)
- English (Philippines)
- English (Nigeria)
- Deutsch
- Español (España)
- Español (México)
- Français
- Italiano
- Nederlands
- Português (Portugal)
- Polski
- Português (Brasil)
- Русский
- Türkçe
- العربية
- Ελληνικά
- Svenska
- Suomi
- עברית
- 日本語
- 한국어
- 简体中文
- 繁體中文
- Bahasa Indonesia
- Bahasa Melayu
- ไทย
- Tiếng Việt
- हिंदी
Tactical Applications Of The Permanent Portfolio
Published 08/26/2012, 02:01 AM
Updated 07/09/2023, 06:31 AM
Tactical Applications Of The Permanent Portfolio
Latest comments
Loading next article…
Install Our App
Risk Disclosure: Trading in financial instruments and/or cryptocurrencies involves high risks including the risk of losing some, or all, of your investment amount, and may not be suitable for all investors. Prices of cryptocurrencies are extremely volatile and may be affected by external factors such as financial, regulatory or political events. Trading on margin increases the financial risks.
Before deciding to trade in financial instrument or cryptocurrencies you should be fully informed of the risks and costs associated with trading the financial markets, carefully consider your investment objectives, level of experience, and risk appetite, and seek professional advice where needed.
Fusion Media would like to remind you that the data contained in this website is not necessarily real-time nor accurate. The data and prices on the website are not necessarily provided by any market or exchange, but may be provided by market makers, and so prices may not be accurate and may differ from the actual price at any given market, meaning prices are indicative and not appropriate for trading purposes. Fusion Media and any provider of the data contained in this website will not accept liability for any loss or damage as a result of your trading, or your reliance on the information contained within this website.
It is prohibited to use, store, reproduce, display, modify, transmit or distribute the data contained in this website without the explicit prior written permission of Fusion Media and/or the data provider. All intellectual property rights are reserved by the providers and/or the exchange providing the data contained in this website.
Fusion Media may be compensated by the advertisers that appear on the website, based on your interaction with the advertisements or advertisers.
© 2007-2025 - Fusion Media Limited. All Rights Reserved.
