One can tell from my posts over the last few months that I have become more bullish on the economy. Are things great? [expletive deleted] no!
The year 2013 has been dogged by consumer expenditures (blue line in graphs below) outrunning consumer income (red line in graphs below). This balance has been restored.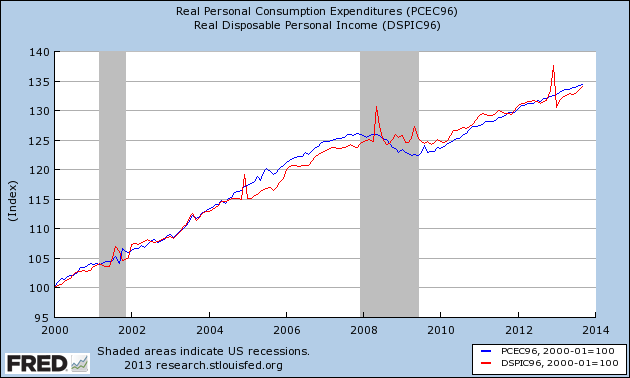
The above graph has indexed expenditures and income to January 2000. To have another perspective – the graph below uses the same data set to show year-over-year change.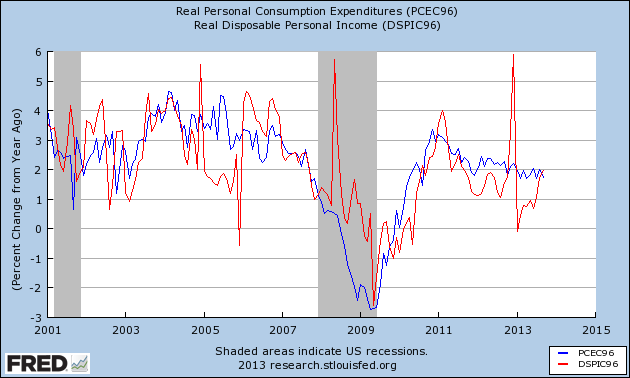
And the following graph provides a closeup on the year-over-year change for 2013. From this graph, one gets the feel why the USA consumer based economy has felt so sluggish this year – as income growth has lagged expenditures.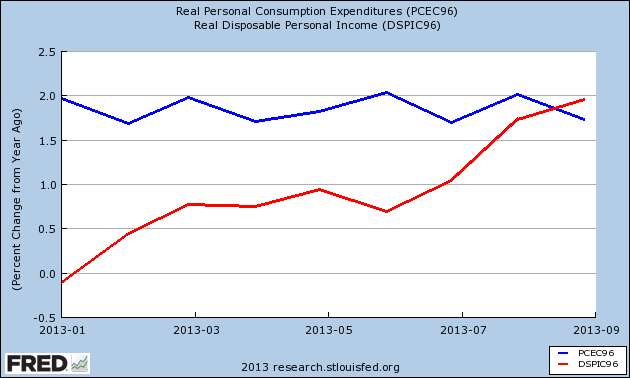
What you may be thinking is that the 0.1% causing this distortion. But listen to the message from Gordon Green of Sentier Research:
“Since August 2011, the low-point in our household income series, we have seen some improvement in the level of real median annual household income. While the trend in household income since August 2011 has been uneven, on balance we have seen an upward movement: by 1.0 percent since September 2012 and by 3.1 percent since August 2011. We still have a significant amount of ground to make up to get back to where we were before, but at least we now appear to be heading in the right direction.”
And here is the chart to back up this statement (red line in graph below): 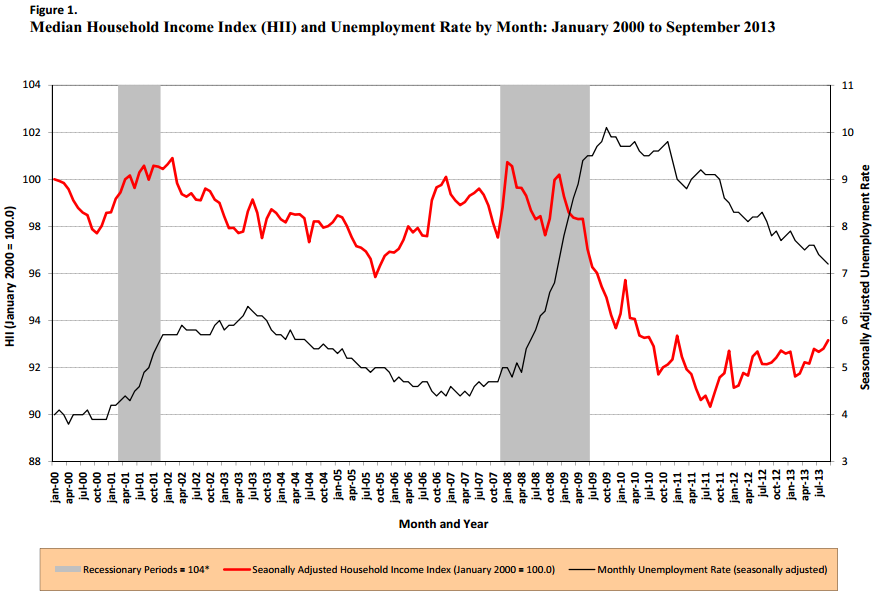
Being real here, median household income is far from its pre-recession peak. All economic analysis is a process of looking at a glass half-full, and trying to extricate the elements which are the drivers. Many make a mistake to believe that drivers are static – I believe in a very dynamic set of economic forces driving a consumer based economy. For now, the good forces are marginally winning. My concern is the forces of evil (aka Obamacare unintended consequences and a housing recovery failure) could drag imagined wealth and suck disposable income from the economy.
For now, income is the important driver as it sets the stage for expenditures (and the USA economy is measured by spending). The economy will not turn a new page overnight but the trends are in the right direction.
Other Economic News this Week:
The Econintersect economic forecast for November 2013 again improved . There is no indication the cycle is particularly strong, as our concern remains that consumers are spending a historically high amount of their income, and the rate of gain on the economic elements we watch are not very strong.
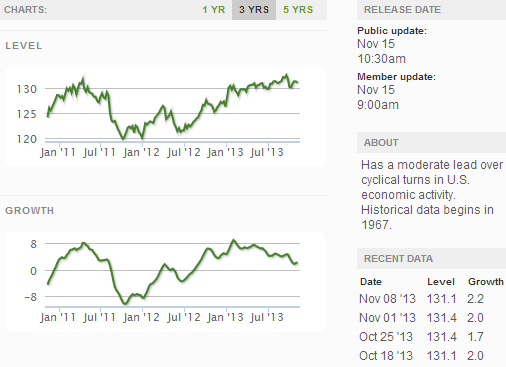
The ECRI WLI growth index value has been weakly in positive territory for over four months – but in a noticeable improvement trend. The index is indicating the economy six month from today will be slightly better than it is today.
Current ECRI WLI Growth Index
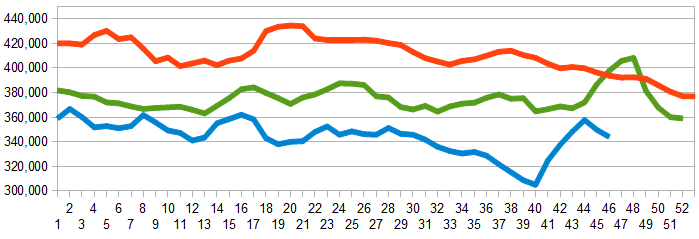
Initial unemployment claims went from 336,000 (reported last week) to 339,000 this week. Historically, claims exceeding 400,000 per week usually occur when employment gains are less than the workforce growth, resulting in an increasing unemployment rate.
The real gauge – the 4 week moving average – improved from 348,250 (reported last week) to 344,000. Because of the noise (week-to-week movements from abnormal events AND the backward revisions to previous weeks releases), the 4-week average remains the reliable gauge.
Weekly Initial Unemployment Claims – 4 Week Average – Seasonally Adjusted – 2011 (red line), 2012 (green line), 2013 (blue line)
Bankruptcies this Week: Global Aviation Holdings, Physiotherapy Associates Holdings
Data released this week which contained economically intuitive components(forward looking) were:
- Rail movements growth trend is continuing to accelerate.
All other data released this week either does not have enough historical correlation to the economy to be considered intuitive, or is simply a coincident indicator to the economy.
Weekly Economic Release Scorecard:
Click here to view the scorecard table below with active hyperlinks

