
T. Rowe Price Group (NASDAQ:TROW) delivered a positive earnings surprise of 4.8% for fourth-quarter 2017. Adjusted earnings per share of $1.52 outpaced the Zacks Consensus Estimate of $1.45. Further, the bottom line improved 25.6% from the year-ago figure of $1.21.
Fourth-quarter results reflect higher revenues and assets under management (AUM). Also, the company’s strong balance sheet position along with ample liquidity were the tailwinds. However, escalating expenses posed a concern.
After considering certain non-recurring items and impact of tax reform, net income for the quarter came in at $347.1 million or $1.37 per share compared with $379.8 million or $1.50 per share recorded in the prior-year quarter.
For full-year 2017, the company reported net income of $1.50 billion or $5.97 per share that compares favorably with $1.22 billion or $4.75 per share in the prior-year quarter.However, results lagged the Zacks Consensus Estimate of $6.06.
Revenues Increase, Expenses Up
Net revenues of $1.29 billion topped the Zacks Consensus Estimate of $1.27 billion. Also, it rose 17.9% from the year-ago quarter. The rise primarily stemmed from higher investment advisory fees that increased 19.7% year over year to $1.16 billion.
For 2017, net revenues were up 13.5% year over year to $4.79 billion. The top line also outpaced the Zacks Consensus Estimate of $4.78 billion.
Distribution and servicing fees rose 7% to $38 million. In addition, administrative fees improved 3.6% to $92.1 million on a year-over-year basis.
Investment advisory revenues generated from the T. Rowe Price mutual funds, distributed in the United States, were up 16.7% year over year to $817.9 million. Investment advisory revenues generated from other investment portfolios, managed by the company, rose 27.1% from the prior-year quarter to $338.1 million.
Total adjusted operating expenses were up 19.4% year over year to $747.7 million in the quarter. Including certain one-time items associated with the Dell appraisal rights matter, expenses were $755.1 million, up 43%.
As of Dec 31, 2017, T. Rowe Price employed 6,881 associates, 9% higher than last year.
Strong Assets Position
As of Dec 31, 2017, total AUM climbed 22.2% year over year to $991.1 billion. During the quarter, net market appreciation and income came in at $40.8 billion while net cash inflow was $3.7 billion after client transfers.
T. Rowe Price remains debt free with substantial liquidity, including cash and investment in its products of about $4.1 billion as of Dec 31, 2017, which enable the company to keep on investing.
Capital Deployment Activity
During the fourth quarter, T. Rowe Price repurchased 15,000 shares of its common stock for $1.4 million. For 2017, it repurchased 6.6 million shares for $458.1 million.
The firm invested $186.1 million during 2017 in capitalized technology and facilities using available cash balances and projects capital expenditures to be approximately $180 million, comprising two-thirds for technology development.
Our Viewpoint
T. Rowe Price’s financial stability has the potential to benefit from growth opportunities in the domestic and global AUM. The company’s debt-free position and diverse business model make us confident of its robust fundamentals, moving ahead. Furthermore, strong investment performance is another positive. However, higher operating expenses keep us apprehensive.
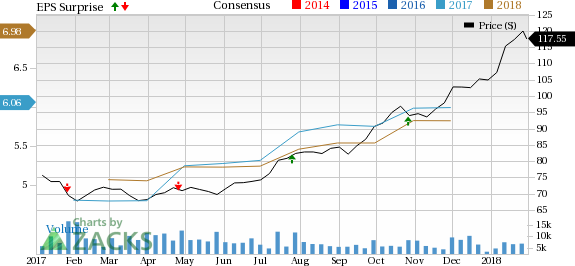
T. Rowe Price Group, Inc. Price, Consensus and EPS Surprise
The stock carries a Zacks Rank #2 (Buy). You can see the complete list of today’s Zacks #1 Rank (Strong Buy) stocks here.
Performance of Other Investment Managers
BlackRock (NYSE:BLK) posted fourth-quarter and full-year 2017 results. Adjusted earnings for the quarter came in at $6.24 per share, which outpaced the Zacks Consensus Estimate of $6.08. Also, the bottom line came in 21% higher than the year-ago quarter.
Ameriprise Financial’s (NYSE:AMP) fourth-quarter 2017 adjusted operating earnings per share of $3.26 comfortably surpassed the Zacks Consensus Estimate of $3.09. Also, the figure compares favorably with $2.73 per share registered in the year-ago quarter.
Despite weak fixed income trading revenues, The Goldman Sachs Group’s (NYSE:GS) fourth-quarter 2017 results recorded a positive earnings surprise of 15.9%. The company reported adjusted earnings per share of $5.68, comfortably beating the Zacks Consensus Estimate of $4.90. Further, the bottom line witnessed 11.8% year-over-year improvement.
Don’t Even Think About Buying Bitcoin Until You Read This
The most popular cryptocurrency skyrocketed last year, giving some investors the chance to bank 20X returns or even more. Those gains, however, came with serious volatility and risk. Bitcoin sank 25% or more 3 times in 2017.
Zacks has just released a new Special Report to help readers capitalize on the explosive profit potential of Bitcoin and the other cryptocurrencies with significantly less volatility than buying them directly.
See 4 crypto-related stocks now >>
Goldman Sachs Group, Inc. (The) (GS): Free Stock Analysis Report
T. Rowe Price Group, Inc. (TROW): Free Stock Analysis Report
AMERIPRISE FINANCIAL SERVICES, INC. (AMP): Free Stock Analysis Report
BlackRock, Inc. (BLK): Free Stock Analysis Report
Original post
Zacks Investment Research